
The sales rate for existing homes in August bounced back slightly from the low hit in July, but it remains well below the tax-credit-driven pace earlier in the year. Existing homes sold at a 4,130,000 annual rate in August. This was 7.6 percent above the July rate, but was more than 20 percent below the average for the first half of the year. The purchase mortgage applications index remains quite depressed relative to earlier this year. It is running close to 30 percent behind its levels for same months of 2009, suggesting that sales in September and October are unlikely to pick up from their current rates.
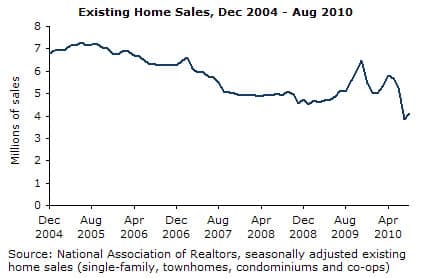
This is consistent with the view that the main impact of the tax credits was to pull purchases forward. While the credits sustained an annual sales rate of well over 5 million for the period it was in effect, the sales pace is likely to remain close to 4 million for the rest of 2010 and 2011. The moving forward of purchases helped to support sales prices during this period, but did nothing to affect the underlying glut of housing. Housing vacancy rates remain at record levels and this will exert substantial downward pressure on prices through the rest of 2010 and into 2011.
Many observers have failed to recognize the significance of the vacancy rate for house prices, since the vacancy rate is much higher in rental units than in ownership units, though even the latter remains near its peaks from 2008. The vacancy rate in rental units will affect sale prices in two ways.
First, vacant rental units will put downward pressure on rents. Many of the markets where the bubble has yet to fully deflate are seeing declines in nominal rents. In Los Angeles, nominal rents in the first half of 2010 were 1.3 percent below their year ago level; in Miami, they were down by 1.5 percent; and in Seattle, by more than 3.0 percent. Falling rents will inevitably put downward pressure on house sale prices, as it will make renting a more attractive option.
The second reason that a large number of vacant rental units will put downward pressure on sale prices is that rental units can be turned into ownership units. This is true of apartments, which can be turned into condominiums if the gap in expected returns from selling versus renting becomes large enough.
However, more than one quarter of the vacant rental units nationwide are single family homes. These can be sold as houses anytime the owner chooses. In many cases, they are put on the market as rental units precisely because the sale market is seen as weak. In the event the sale market strengthened, or the rental market weakened further, these units would be put up for sale, increasing the supply of homes on the market. In short, it is important to consider the vacancy rate in both ownership and rental units in determining the extent of oversupply in the housing market.
The Case-Shiller data for July is showing the first evidence that prices are resuming their fall following the expiration of the tax credit. The 20-city index rose by 0.6 percent in July. The 8.1 percent annualized rate of growth in the 20-city index is below the 13.5 percent rate of the three months ending in June.
It is important to remember that the Case-Shiller index is a three-month average. This means that the July number only includes one month (July) in which most of the contracts were signed following the expiration of the tax credit. Therefore, it is only capturing the beginning of a price decline that is likely already much sharper than the index indicates.
Nevertheless, the most recent data already show price declines in many cities, particularly the South and West. Las Vegas led the declines with a 0.8 percent fall in June — a 20.2 percent annualized rate of decline over the last three months. Prices in Phoenix fell 0.6 percent after remaining flat in June. Denver home prices fell 0.4 percent (a 4.4 percent annualized rate) after rising at a 13 percent rate the three months prior.
Some major cities saw large price increases: Chicago, Detroit, New York, and Washington, D.C. all saw prices rise at least 1.0 percent in July. However, cities that showed large price increases in previous months are showing a deceleration in the rate of growth. Prices in Chicago rose 1.0 percent and 1.6 percent in July compared with 2.5 percent in June. The city with the largest price increase in June — Minneapolis — showed a price increase of 0.8 percent after rising 2.8 percent in May and 2.7 percent in June.
By contrast, cities with larger price increases in July relative to June had relatively slow price growth in previous months. Home price inflation accelerated more in San Diego than any other city — up 0.7 percent in July after a 0.4 percent gain in June.
Again, the fact that the reversal of price acceleration in the July data is based on contracts signed no later than May points to recent home price gains being the result of the tax credit rather than a sustained rebound in prices. Over the next two months we can expect more rapid deceleration and deflation in house prices.
David Rosnick is an economist at the Center for Economic and Policy Research in Washington, DC. This article was first published by CEPR on 28 September 2010 under a Creative Commons license.
| Print