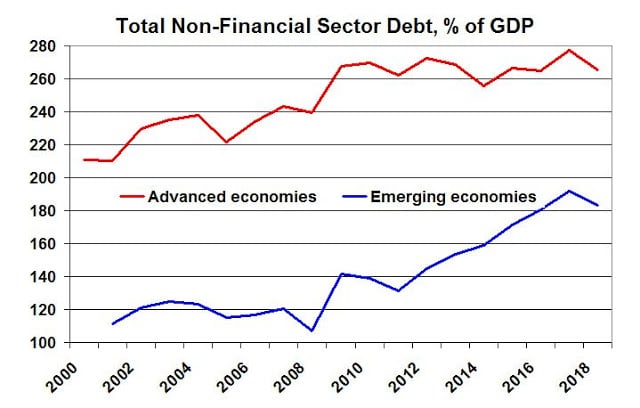
For the first time in a decade, the ratio of debt to GDP fell back in 2018 for both advanced and emerging market economies. It nevertheless remains high, much higher than at the start of the 2007-08 crisis, and has also continued to rise in some major economies.
The first chart shows the global picture, broken down into the two main country groups counted by the Bank for International Settlements. The ‘advanced’ countries are basically 22 rich ones; the ‘emerging market’ economies are 21 others.* Note also that the data cover the outstanding credit advanced to the non-financial sector, including non-financial corporations, the government and households.
Data for the ratio of debt-to-GDP are given in the next table. It shows that Japan remains a basket case, and its debt ratio has continued to rise. France looks to be in one of the worst positions among the major capitalist countries, with its debt ratio also rising and going above 300% of GDP. While the debt held by the French government has held steady, it has grown among households and corporations. This will keep President Macron and the Gilets Jaunes busy. Elsewhere among the euro countries, the debt ratio has been falling, notably in Germany.
Total credit to the non-financial sector, 2013-18 (% GDP)
| 2013 | 2015 | 2017 | 2018 | |
| Advanced economies | 268.4 | 266.5 | 277.3 | 265.5 |
| Emerging market economies * | 153.3 | 171.2 | 191.8 | 183.2 |
| —————————————– | ||||
| US | 247.4 | 247.2 | 250.5 | 249.8 |
| Japan | 363.4 | 362.0 | 370.9 | 375.3 |
| UK | 267.7 | 267.1 | 283.1 | 279.3 |
| —————————————– | ||||
| China | 212.7 | 239.3 | 253.4 | 254.0 |
| South Korea | 220.3 | 232.0 | 231.2 | 238.2 |
| —————————————– | ||||
| Germany | 192.3 | 185.2 | 178.3 | 175.7 |
| France | 281.9 | 300.8 | 310.0 | 311.0 |
| Italy | 253.5 | 270.6 | 259.7 | 252.6 |
| Euro area average | 264.0 | 271.3 | 262.8 | 258.2 |
Brexit Britain saw the debt ratio fall a little in 2018, but the odds must be for a further rise of indebtedness this year and next. If likely PM-to-be BoJo can waste so much money as London mayor–from water cannons to garden bridges, buses and a cable car–just think what an empowered narcissist’s plans could be!
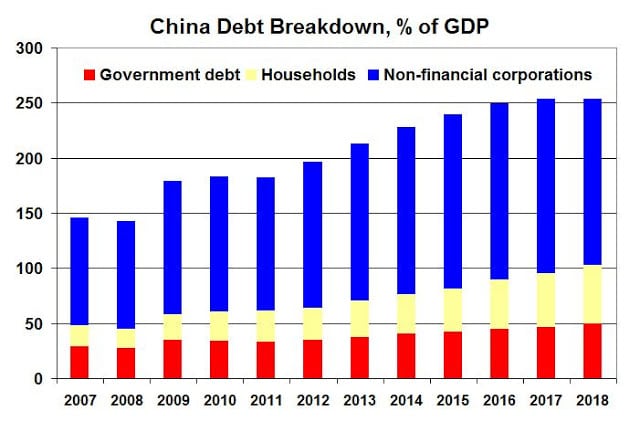
China’s debt ratio has risen among the fastest in the past decade or so. Yet the total, at close to 250%, has stabilised in the past year or so and is now similar to that in the U.S.. Ironically, the breakdown shows that ‘communist’ China’s government debt ratio at just below 50% is only half that in the ‘free market’ U.S., where it registers close to 100% of GDP.
China’s household debt is also lower than in the U.S., but its non-financial corporate debt is much higher. Nevertheless, around 100% is a common government debt ratio for major countries. Even Germany’s is only just below 70%. So these data would suggest that China has plenty of room, if it chose, to boost its government debt and bail out any corporates in trouble (quite apart from the ability to use its $3.1 trillion of FX reserves).
Note: * The BIS emerging market economies are: Argentina, Brazil, Chile, China, Colombia, the Czech Republic, Hong Kong SAR, Hungary, India, Indonesia, Israel, South Korea, Malaysia, Mexico, Poland, Russia, Saudi Arabia, Singapore, South Africa, Thailand and Turkey.


