Over the last year, there has been an escalation in the political battles between the government of President Evo Morales and a conservative opposition, based primarily in the prefectures, or provinces. The opposition groups have rallied around various issues but have recently begun to focus on “autonomy.” Some of the details of this autonomy are legally complex and ambiguous, and they vary among the provinces whose governments are demanding autonomy. Since May of this year, four prefectures — Santa Cruz, Beni, Pando, and Tarija, which are often referred to as the “Media Luna”1 — have held referenda, which were ruled illegal by the national judiciary,2 in which a majority of those voting voted in favor of autonomy statutes.
While there are a number of political and ideological aspects to this conflict, this paper focuses on one of the most important underlying sources of the dispute: the distribution of Bolivia’s most important natural resources. For reasons described below, these are arable land and hydrocarbons.
This paper shows that the ownership and distribution of these key resources are at the center of the current conflict. Furthermore, it appears that reform of this ownership and distribution may be necessary for the government to deliver on its political promise to improve the living standards of the country’s poor majority, who are also disproportionately indigenous. According to the most recent data, Bolivia has a poverty rate of 60 percent. The proportion of people in extreme poverty is about 38 percent (UDAPE, 2008). Extreme poverty means not having regular access to basic needs for survival: for example, about 28 percent do not have drinkable water, and about 24 percent of children under 3 years old are malnourished. Poverty is much more concentrated in rural areas, where it averages 76.5 percent (World Bank, 2005).
With 39.5 percent of the labor force employed in agriculture (UDAPE, 2008), it seems clear that land redistribution is not only one of the most important demands to the electorate that voted for the current government, but also an important means by which to address the problems of rural development and poverty. Furthermore, the national government was elected on a program of getting control over the country’s hydrocarbon revenue and using that revenue for poverty alleviation and development. This commitment may also be difficult or impossible to fulfill without the central government having sufficient control over these key resources and revenues.
Land Tenure in Bolivia
Data on land tenure (e.g. number and size of landholdings by department) in Bolivia are not recent. The last comprehensive agricultural census, for example, was carried out in 1984.3 However, although there have been significant changes over the last two decades, it is unlikely that the distribution has become much more equal. For example, in 1953 there was a Land Reform decree. There was significant redistribution of land from large landholders to indigenous peasants in the beginning, but around the late 60s and 70s and then again in the 1990s, vast amounts of land were given to a smaller group of individuals in the eastern part of the country, accompanied by corruption.
According to the First National Agricultural Census in 1950, 4 percent of all agricultural units controlled more than 82 percent of surveyed land surface (Morales et al, 2000).4 Three decades later, land was even more unequally distributed than before. By 1984, according to the Second National Agricultural Census, 3.9 percent of all farm units were over 100 hectares in size and occupied 91 percent of all farm surface surveyed.
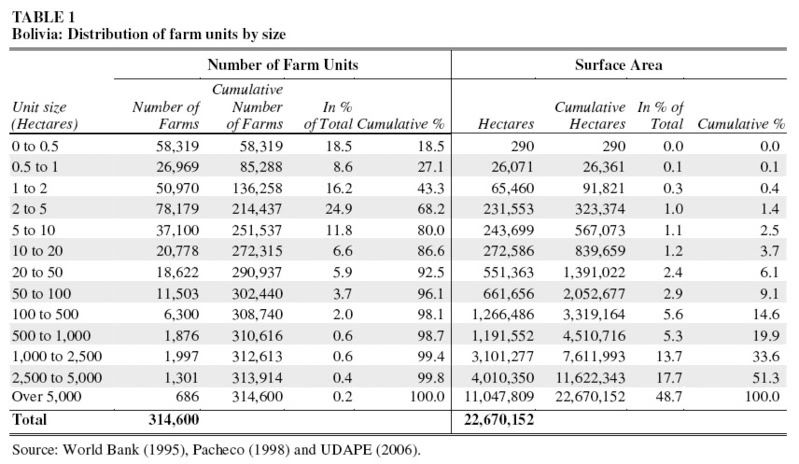
The 1984 Census has, therefore, been used in research on land tenure in Bolivia for the last two decades, for example World Bank 1995, UDAPE 2006, Pacheco 1998.5 Table 1 shows the distribution of land by farm units from less than 0.5 hectare to 5,000 hectares.6
It can be seen that Bolivia’s land ownership is enormously concentrated. Just 686 farm units, or 0.22 percent of the total landowners, have a majority of the land area. These are farms of more than 5,000 hectares, with an average size of more than 16,000 hectares, and some estates in the hundreds of thousands of hectares. If we include the next rung of the ownership ladder, farms over 2,500 hectares, the combination of these 1,300 farms plus the previous 686 amounts to just 0.63 percent of the total. But, these farms account for more than 66 percent of all agricultural land.
At the other end of the spectrum, 86 percent of farms account for just 2.4 percent of agricultural land; and, of course, there are many rural families without any land.
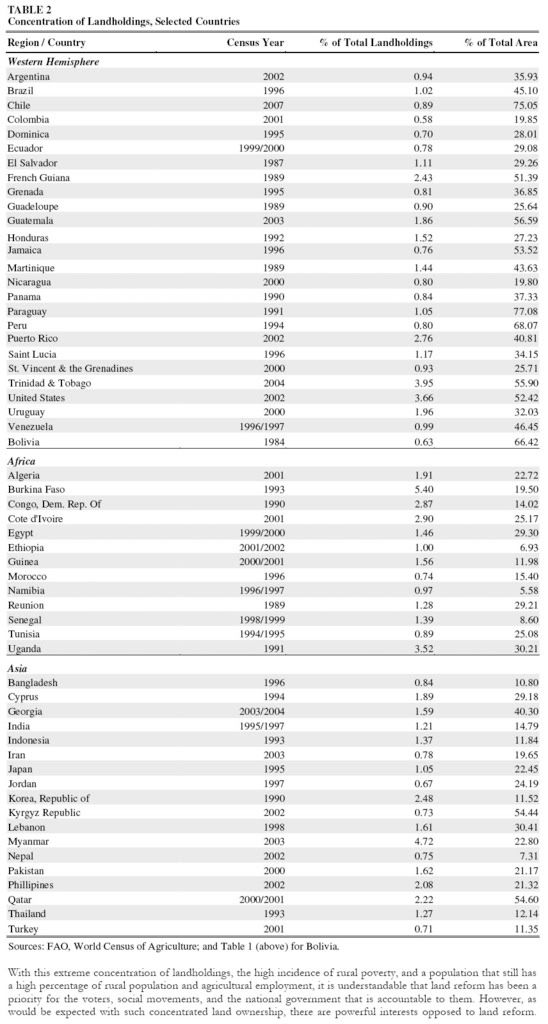
The concentration of land in Bolivia among a very small group of landowners appears to be almost the worst in the entire world with the exception of Chile. The top part of Table 2 shows the concentration of ownership among the largest landholders in various countries in the western hemisphere for which data are available. In this data set, Bolivia’s concentration of 66.4 percent of agricultural land among just 0.63 percent of landholders stands out.7 For comparison, the rest of the table includes countries from Africa and Asia. As can be seen, the distribution of land is considerably more concentrated in Latin American than in these regions.
With this extreme concentration of landholdings, the high incidence of rural poverty, and a population that still has a high percentage of rural population and agricultural employment, it is understandable that land reform has been a priority for the voters, social movements, and the national government that is accountable to them. However, as would be expected with such concentrated land ownership, there are powerful interests opposed to land reform.
While there are no comparable detailed data on the distribution of land by prefecture, it is clear that much of the concentration of large landholdings is in Santa Cruz. Santa Cruz is the largest prefecture in terms of land mass, population, and GDP, with 24.5 percent of the population and 28.2 percent of the country’s GDP. (See Table 3 below). It is, therefore, the leader of the Media Luna group of provincial governments opposed to the national government.
In 2005, the Bolivian Ministry of Farmer and Agricultural Affairs estimated that 37 percent of farm units were located in the Altiplano region (mainly La Paz, Oruro, and Potosí) and covered 6 percent of cultivated land; 46 percent of farm units in the Valleys region (Cochabamba, Chuquisaca, and Tarija), covering 17 percent of cultivated land; and 17 percent of farm units in the Llanos region (Santa Cruz, Beni, and Pando), covering 77 percent of cultivated land (IFAD, 2005: p. 4). It is clear that the large landowners of these Media Luna provinces, especially Santa Cruz, account for most of the concentration of land ownership and have the most at stake in opposing any land reform. (Tarija, the fourth Media Luna province, holds 60 percent of the country’s natural gas reserves — see below). Some of the most important leaders of the opposition in Santa Cruz are large landowners. For example, Branco Marinkovic, president of the Pro-Santa Cruz Civic Committee (the powerful opposition business civic association in Santa Cruz), is reportedly one of the largest landowners in that department, with some 12,000 hectares (30,000 acres) of land.8 The government has found that 14 families of opposition politicians and businessmen own around 313,000 hectares of land in Santa Cruz and Beni.9
There is another reason that the large landowners and agricultural interests have reason to fear a central government that might want to exert more control over land use policies. Bolivia currently imports and heavily subsidizes diesel fuel, which is used by the large farmers in the Media Luna provinces and especially Santa Cruz. The cost of the government’s diesel subsidy in 2007 was about $335 million and of course is running at a much higher rate this year as diesel prices have increased. This is quite a large subsidy, about 2.5 percent of Bolivia’s GDP and 6 percent of the federal budget. The amount that goes to Santa Cruz is $135 million, or 40 percent of the total. Not all of this is for agriculture. But agriculture accounts for about 15 percent of the GDP of Santa Cruz, and the subsidized diesel also contributes significantly to lowering the transport costs for grain produced in landlocked Bolivia, which has notoriously high transport costs (see Table 3, below).
The main economic argument against land redistribution is that the large farm units are more efficient and productive than smaller ones. However, with subsidies of this size to the largest agricultural units in Santa Cruz, this economic argument is undermined. Furthermore, even with the current level of diesel subsidies, the large soy producers do not appear to be competitive on world markets, and they therefore export to the protected markets of the Andean Community (see Table 3). In April of this year, the Finance Ministry announced that an inter-ministerial commission had been formed to evaluate the possibility of eliminating the diesel subsidy.10 Thus, large landowners, especially in Santa Cruz, may have a direct interest in the more extreme forms of autonomy — not only to prevent land reform directly, but to ensure that the provincial government would continue to subsidize their production even if these subsidies were found, on economic grounds, to be wasteful, inefficient, and/or regressive in terms of income redistribution. It might be possible to maintain these subsidies in spite of the central government’s decisions, for example, if the provincial government could get control over revenues that now accrue to the central government.

Source: Kreidler et al (2004).11
The “Media Luna” and Other Provinces: Economic and Demographic Characteristics
Before focusing on the issue of the distribution of hydrocarbons revenue, it is worth looking at some of the economic and demographic differences between the provinces.
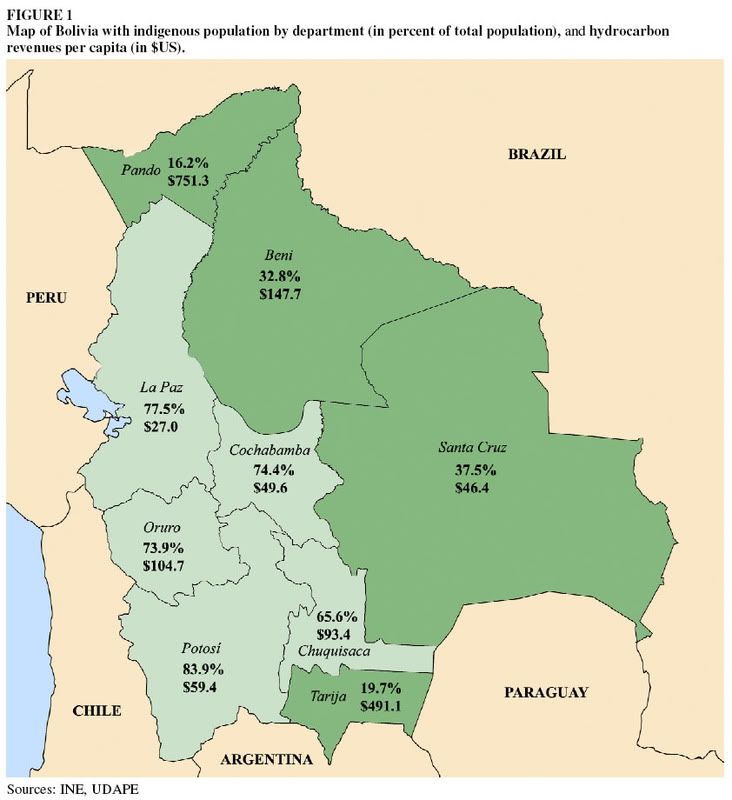
As can be seen in Figure 1 (next page), the Media Luna provinces — Santa Cruz, Tarija, Beni, and Pando — have a much lower indigenous population than the rest of the country, ranging from 16.2 percent in Pando to 37.5 percent in Santa Cruz; this compares with an average of 62 percent for the rest of the country. This is clearly a vast demographic gap in a country where the indigenous majority has suffered centuries of discrimination. Indigenous Bolivians today have much higher rates of poverty, extreme poverty, illiteracy, and malnutrition. For example, nonindigenous labor income is about 2.2 times that of indigenous labor income; and non-indigenous Bolivians have an average of 9.6 years of schooling versus 5.9 for indigenous Bolivians (World Bank, 2005).
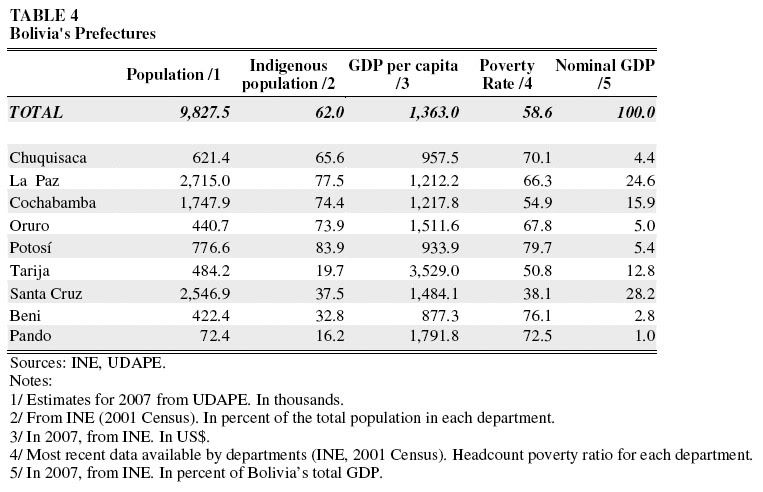
Table 4 shows the population of the provinces, the percent of indigenous population, per capita income, and poverty rate. In the Media Luna group, Santa Cruz predominates, with more than 2 million people — compared with less than half that for the other three states combined. The state accounts for 33.7 percent of Bolivia’s territory and 28.2 percent of its GDP. As noted above, Santa Cruz, Beni, and Pando (three of the four Media Luna provinces) have large landholders who own the vast majority of Bolivia’s agricultural land. Pando has only 52,525 people and has very poor ground transportation.
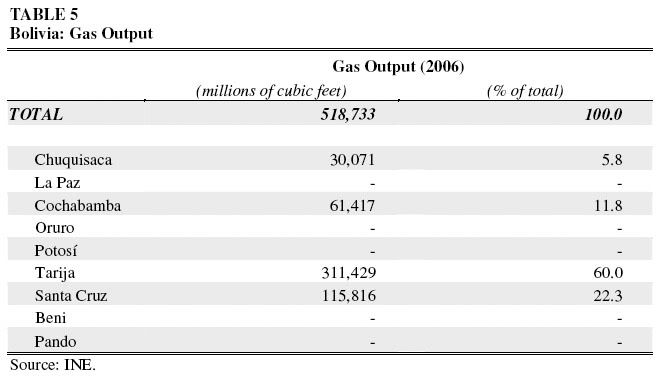
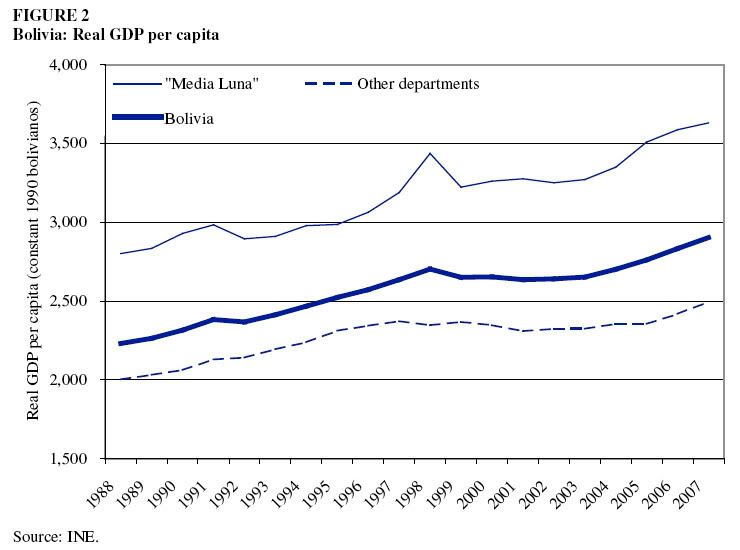
Tarija, the fourth Media Luna province, has just 4.9 percent of Bolivia’s population but 85 percent of the country’s natural gas reserves. Table 5 shows natural gas production by province. Tarija leads with 60 percent of the country’s production. Santa Cruz is second with 22.3 percent. Thus, more than 82 percent of natural gas production is concentrated in these two Media Luna states. In Table 4, it can be seen that the Media Luna states as a group also have a much higher per capita income than the other provinces. This is also shown in Figure 2. In 2007, the Media Luna provinces had a per capita income about 1.4 times the other provinces: $1,698.58, as compared to $1,175.28.
Tarija was the richest by far, with a per capita income of $3,529.0, 137.8 percent higher than the Media Luna leader Santa Cruz. The poorest Media Luna state was Beni, with a per capita income of $877.3, similar to that of the province of La Paz.
It is worth noting the differences in income distribution in the provinces, as reflected in the uneven relationship between poverty rates and per capita income across provinces. For example, the per capita income of Santa Cruz is comparable to that of Oruro, but poverty in Santa Cruz is only 38 percent as compared to 67.8 percent in Oruro. Similarly, Pando ranks second in per capita income but also has the second highest poverty rate.
Hydrocarbon Revenues
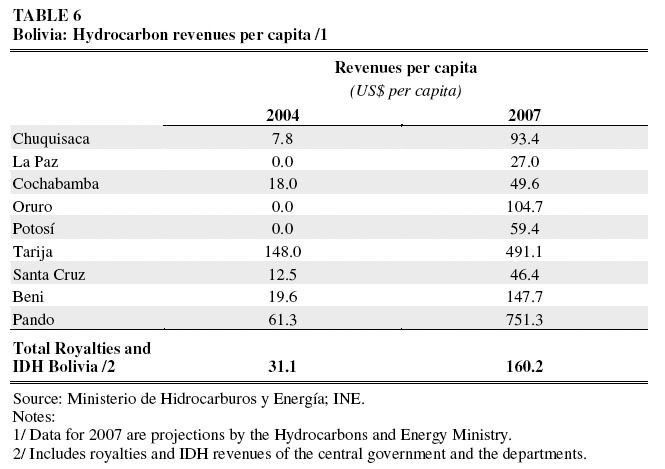
Table 6 shows the distribution of hydrocarbon revenues by province, on a per capita basis. There was a vast increase in hydrocarbon revenue from 2004 to 2007. This was a result of the 2005 hydrocarbons law and the renationalization in 2006, which greatly increased the government’s take, and also the general increase in energy prices. The result was an increase of $1.3 billion dollars, or about 10 percent of GDP, from 2004-2007. In Table 6, this is shown on a per capita basis, from $31.1 to $160.2 dollars per capita, a more than fivefold increase in three years.
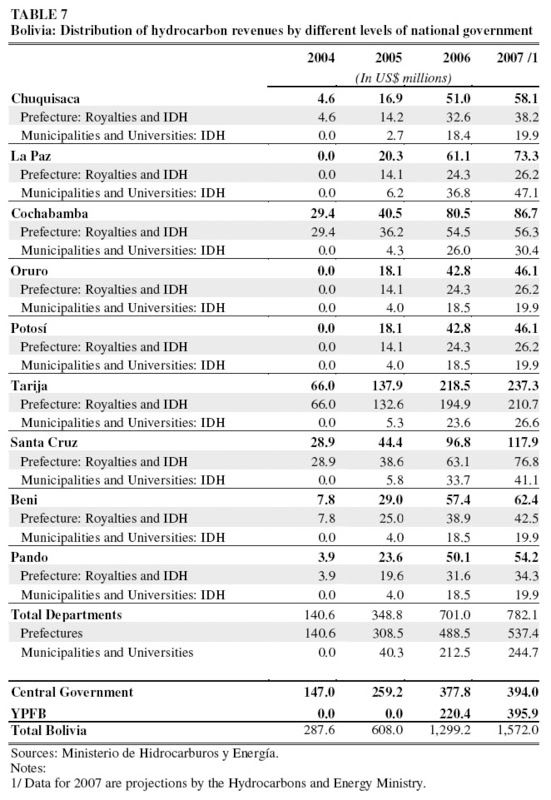
As can be seen from the table, all provinces gained from this increase, although with vast disparities. Pando, which does not produce any of the gas, leads with $751 per capita — although with only 72.4 thousand people, it does not take a large share of the revenue. Tarija, which produces 60 percent of the gas, is second with $491 per capita. This is still more than 18 times the per capita revenue of La Paz ($27), which has two-thirds of its population below the poverty line. Beni, another Media Luna state, is next with $148 per capita. Santa Cruz, the leader of the Media Luna, does not do particularly well with $46 per capita, although it is the second largest producer. But the Media Luna states as a group have the lion’s share of the hydrocarbon revenue: 30 percent, as compared to 19.7 percent for the other five states (whose combined population is 79 percent greater than the Media Luna). This is shown in Table 7, which shows the distribution of total hydrocarbon revenue by province.
Perhaps even more striking than the distribution of hydrocarbon revenue between the provinces is the relatively small amount that goes to the central government. As can be seen in Table 7, only about 25 percent of total hydrocarbon revenue accrues to the national government. Another 25.2 percent accrues to the national hydrocarbons company (YPFB). About half, or 49.7 percent, goes to the prefectures, municipalities, and universities.
The details regarding current collection and distribution of hydrocarbon revenues are explained in the Appendix.
Of all the oil and gas producers in the world, where hydrocarbons are a sizeable share of national income and/or export earnings, there is probably no country where sub-national governments get such a large share of the hydrocarbon revenue. In most developing countries, it is assumed that these valuable resources belong to the nation as a whole, not to the particular region in which they happen to be underground. This is especially important for developing countries, since their development strategy — the means by which they can eliminate extreme poverty and reduce overall poverty — is based on using the rents from their mineral wealth to diversify away from hydrocarbons, as well as investing in economic and social infrastructure. Of course, this is even more important in a time of high energy prices. The Media Luna states are advocating in another direction: in a country that already distributes its hydrocarbon revenues more than any in the world to provincial and local governments, they want even more to go to the provincial governments. This would make it more difficult for the government to pursue an overall economic development strategy.
Conclusion
This paper has examined Bolivia’s two most important natural resources — land and hydrocarbons — in the context of a political conflict between several provincial governments and the national government. While there are many factors that play a role in this conflict — including race and ethnicity, centralism versus federalism and local control, the conflict over where the nation’s capital should be located — it is clear that the distribution of Bolivia’s land and hydrocarbon revenue occupies an important and possibly central role in the dispute. While there is room for compromise and give-and-take on many issues with regard to autonomy and the powers of provincial and local governments, it may be difficult or impossible for the government to deliver on its promises without significantly altering the distribution of land. Also, to cede even more control over hydrocarbons resources to the provincial governments, where it is already very unequally distributed, would make governing even more difficult.
Appendix: Current Collection and Distribution of Hydrocarbons Revenues
Hydrocarbon revenues in Bolivia can be divided into two main groups. The first group refers to those revenues collected at the production stage and currently include royalties and the Direct Tax on Hydrocarbons (Impuesto Directo a los Hidrocarburos — IDH). The second group refers to direct and indirect taxes collected during the distribution, refining, and marketing stages. Some of these taxes apply to all companies operating in the country (whether foreign or national), such as sales and income taxes, and other taxes apply only to the hydrocarbons sector (Velásquez-Donaldson, 2007).12 Of these taxes levied specifically on the hydrocarbons sector, the most significant one in terms of revenue generation is the Special Tax on Hydrocarbons and Derived Products (Impuesto Especial a los Hidrocarburos y sus Derivados — IEHD), applied to the sale of hydrocarbon products, whether national or imported, in the domestic market.
At present, the structure of royalty payments on hydrocarbon production is based on the 2005 Hydrocarbons Law and the 2006 Nationalization Decree (Supreme Decree No. 28701). The basis for royalty and IDH (explained below) payments is the net hydrocarbon production, which consists of the volume of hydrocarbons produced every month, net of any oil or gas used in the operation of the field. Where a private company operates the field, the net hydrocarbon production is transferred from the company to the national hydrocarbons company, YPFB (Yacimientos Petrolíferos Fiscales Bolivianos), which is in charge of administering the process of transporting and selling the hydrocarbons. YPFB then makes the payments to the national government for patents, royalties, and the IDH. It then pays the operating company for its recovery costs, and shares the rest based on a formula establishing YPFB’s share. This formula depends, among other things, on the volume produced by the field, the amounts invested, and some taxes paid by the firm (Vargas 2007; YPFB 2006).
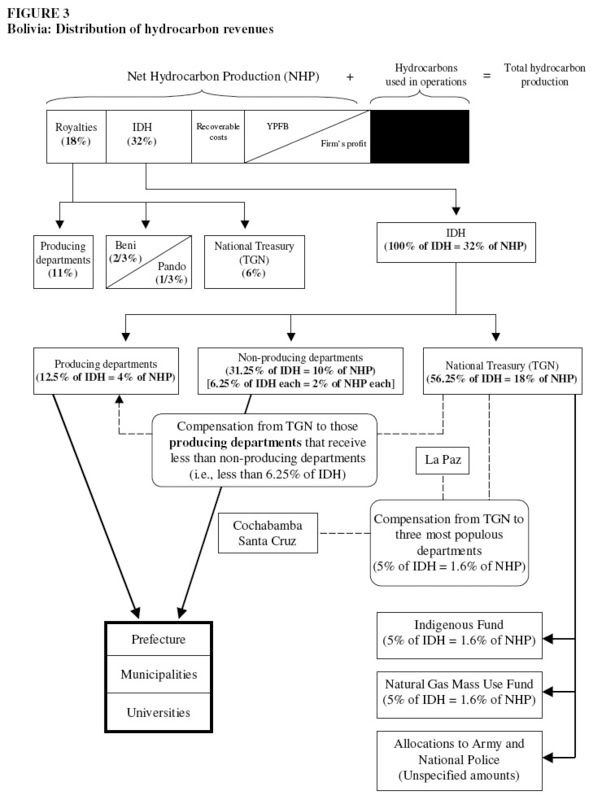
The distribution of royalties disproportionately benefits the departments that produce hydrocarbons, which receive a royalty of 11 percent of the total production in that department. Additionally, the law establishes a National Compensatory Royalty of 1 percent of the national hydrocarbon production for the departments of Beni and Pando, each receiving 2/3 and 1/3 of this royalty, respectively. Finally, the central government (through the National Treasury) receives a royalty of 6 percent of the total national production.
In addition to royalties, YPFB pays a 32 percent Direct Tax on Hydrocarbons (IDH) on each field’s production. This is then distributed at different levels among the departments, municipalities, universities, the central government, and some special funds. The funds generated by this tax have specific spending guidelines at the different levels but in general, they must be used for education, health, security, and employment promotion.13
At the broadest level, the total IDH revenues are distributed between the departments and the central government: 12.5 percent goes to the producing departments (each department getting a share according to its hydrocarbon production); 31.25 percent goes to the non-producing departments (6.25 percent each), and the rest (56.25 percent) goes to the National Treasury (central government). However, if a producing department receives a lower amount of revenues than the non-producing departments, the National Treasury must compensate the producing department so that it receives the same amount of revenues as the non-producing departments.
At the departmental level, the IDH revenues are distributed among the prefecture (the departmental government), the municipalities (the department’s subdivisions or districts), and the department’s public university or universities. The municipalities receive 34.48 percent of the department’s total IDH revenues and each municipality’s share depends on its share of the department’s total population. The department’s public university obtains 8.62 percent of these revenues; if there is more than one public university in the department, this percentage is distributed according to an agreement between the universities, the Finance and Education ministries, and the Executive Committee of Bolivian Universities. Finally, the rest (56.9 percent) is allocated to the department’s prefecture.
After compensating producing departments as indicated above, the central government must also pay for certain allocations that reduce its share of total IDH revenues. The first of these mandated allocations (5 percent of total IDH revenues) is distributed among the municipalities and universities of the three most populous departments: La Paz (46.19 percent), Santa Cruz (36.02 percent), and Cochabamba (17.79 percent). In each of these departments, 80 percent is allocated to the municipalities (according to their share of the department’s total population) and 20 percent to the public university or universities.
The central government must also pay for another 5 percent of total IDH revenues allocated to a Development Fund for Indigenous Peoples and Peasant Communities. These resources are meant to fund projects created by indigenous organizations, which are then implemented by the prefectures and municipal governments.
A similar allocation (5 percent of total IDH revenues) is made for another fund meant to foster the mass use of natural gas in Bolivia.
Finally, the central government must also make certain allocations to the army and the national police. There are no specific percentages assigned to these institutions, and instead, they must be made through specific programs and projects in each institution’s budget. Therefore, it is unclear what impact these allocations have on the central government’s final share of IDH revenues.
The above relationships and distribution of revenues are diagrammed in Figure 3.
Given this distribution and according to data from the Hydrocarbons Ministry (see above), all hydrocarbon revenues generated through royalties and the IDH in 2007 amounted to $1.572 billion, of which 25 percent accrued to the central government (through the National Treasury). Most of these revenues went to the different prefectures, municipalities, and universities (49.7 percent), and another 25.2 percent went to the national hydrocarbons company (YPFB).
1 The “Media Luna,” or Half-Moon, refers to the shape of these four provinces in carving out a half-moon of the eastern part of the national territory.
2 Corte Nacional Electoral, República de Bolivia (2008), “Resoluciones de la Corte Nacional Electoral.” Resolución Nº 014/2008, Cochabamba. Accessed on 28 July 2008.
3 The 1984 National Agricultural Census (II Censo Nacional Agropecuario) was the second of its kind in Bolivia, and because it was done during a period of political and economic turmoil, it could not fully cover the departments of La Paz and Oruro. The first agricultural census was carried out in 1950 (INE, 2005). The current government has approved the Third National Agricultural Census, to be carried out in two stages between 2008 and 2009 (see, for example, Agencia Boliviana de Información. 14 May 2008. “Gobierno autoriza realización de tercer censo agropecuario en dos etapas,” 28 July 2008).
4 Morales, Rolando, Erwin Galoppo, Luis Carlos Jemio, María Carmen Choque, Natacha Morales (2000), “Bolivia: Geografía y Desarrollo Económico,” Inter-American Development Bank: Washington, DC.
5 World Bank (1995), “Staff Appraisal Report. Bolivia. National Land Administration Project,” Report No. 13560-BO, World Bank: Washington, DC; Pacheco Balanza, Diego (1998), “Bolivia: Modelos de desarrollo y cambios en la sociedad rural y sector agropecuario,” Fundación Tierra: Bolivia; Unidad de Análisis de Políticas Sociales y Económicas (2006), “Sector Agropecuario Bolivia, 1990-2004,” UDAPE: La Paz.
6 One hectare = 2.47 acres or 10,000 square meters
7 Data is reported according to the size of landholdings, so it is not possible to compare, e.g., the top 0.63 percent of landholders in Bolivia with the same percentage in other countries. The numbers in this table represent the closest that can be found for the purposes of comparison at the top of the distribution. In this table, it can be seen that Paraguay’s concentration of land is also very high and appears as though it could be worse than Bolivia’s; however, in Bolivia the top 1.86 percent of landowners holds 85.4 percent of land, as compared to 85.7 percent of land belonging to 2.69 percent of landholders in Paraguay.
8 BBC News World. 14 September 2006. “Struggle for land in Bolivia.” British Broadcasting Network. 28 July 2008. Other sources suggest Marinkovic’s family owns some 27,000 hectares of land that were acquired illegally and are in dispute: Inter-Press Service. 27 December 2007. “BOLIVIA: Guarayo Indians Struggle to Hold Onto Their Land.” 28 July 2008; Bolpress. 17 September 2007. “Reforma Agraria alista la reversión de tierras de Branco Marinkovic.” 28 July 2008. Marinkovic also held shares in the recently nationalized gas transportation company, Transredes.
9 Bolpress. 23 November 2006. “14 familias detentan 312.966 hectáreas de tierra en Santa Cruz y Beni.” 28 July 2008; Bolpress. 17 November 2006. “Terratenientes forman un frente de defensa del latifundio.” 28 July 2008.
10 La Prensa. April 16 2008. “El gobierno estudia eliminar subsidio a más de 700.000 litros de diesel que consume a diario el agro cruceño.” 28 July 2008.
11 Kreidler, A., Rodríguez, G., Rocha, A., Antelo, E. (2004), “La soya boliviana hacia el mercado libre en las Américas,” USAID/Bolivia, Economic Opportunities Office, cited in Patricia Molina and Sorka Copa (2005), “¿La agricultura soyera en Bolivia, necesita transgénicos?” FOMADE, Bolivia.
12 Christian Velásquez-Donaldson (2007), “Analysis of the Hydrocarbon Sector in Bolivia: How Are the Gas and Oil Revenues Distributed?” Institute for Advanced Development Studies, Development Research Working Paper Series No. 6/2007.
13 The distribution of IDH revenues is ruled by Supreme Decree No. 28421 (October 21, 2005).
Works Cited
Agencia Boliviana de Información. 14 May, 2008. “Gobierno autoriza realización de tercer censo agropecuario en dos etapas.” 28 July 2008.
BBC World News. 14 September 2006. “Struggle for Land in Bolivia.” British Broadcasting Corporation. 28 July 2008.
Bolpress. 17 September 2007. “Reforma Agraria alista la reversión de tierras de Branco Marinkovic.” 28 July 2008.
Bolpress. 23 November 2006. “14 familias detentan 312.966 hectáreas de tierra en Santa Cruz y Beni.” 28 July 2008.
Bolpress. 17 November 2006. “Terratenientes forman un frente de defensa del latifundio.” 28 July 2008.
IFAD. 2005. “Republic of Bolivia. Country Programme Evaluation.” International Fund for Agricultural Development: Rome, Italy.
IPS News. 27 December 2007. “BOLIVIA: Guarayo Indians Struggle to Hold Onto Their Land.” Inter Press Service News Agency. 28 July 2008.
Kreidler, A., Rodríguez, G., Rocha, A., Antelo, E. 2004. “La soya boliviana hacia el mercado libre en las Américas.” USAID/Bolivia Economic Opportunities Office: Bolivia, in Patricia Molina and Sorka Copa. 2005. “¿La agricultura soyera en Bolivia, necesita transgénicos?” FOBOMADE: Bolivia.
La Prensa. 16 April 2008. “El gobierno estudia eliminar subsidio a más de 700.000 litros de diesel que consume a diario el agro cruceño.” 28 July 2008.
Morales, Rolando, et al. 2000. “Bolivia: Geografía y Desarrollo Económico.” Inter-American Development Bank: Washington, DC.
Pacheco Balanza, Diego. 1998. “Bolivia: Modelos de desarrollo y cambios en la sociedad rural y sector agropecuario.” Fundación Tierra: Bolivia.
Unidad de Análisis de Políticas Sociales y Económicas. 2006. “Sector Agropecuario Bolivia, 1990-2004.” UDAPE: La Paz.
Unidad de Análisis de Políticas Sociales y Económicas. 2008. “Dossier de estadísticas sociales y económicas de Bolivia.” UDAPE: La Paz.
Vargas, Maria Victoria. 2007. “Bolivia’s New Contract Terms: Operating. Under the Nationalization Regime.” Oil, Gas & Energy Law Intelligence (OGEL), Vol. 4, Issue 5, November 2007.
Velásquez-Donaldson, Christian. 2007. “Analysis of the Hydrocarbon Sector in Bolivia: How Are the Gas and Oil Revenues Distributed?” Institute for Advanced Development Studies, Development Research Working Paper Series No. 6/2007.
World Bank. 1995. “Staff Appraisal Report. Bolivia. National Land Administration Project.” Report No. 13560-BO, World Bank: Washington, DC.
World Bank. 2005. “Bolivia. Poverty Assessment: Establishing the Basis for Pro-Poor Growth.” Report No. 28068-BO, World Bank: Washington, DC.
YPFB. 2006. “República de Bolivia. Modelo Tipo de Contrato de Operación.” Yacimientos Petrolíferos Fiscales Bolivianos: Bolivia.
Mark Weisbrot is Co-Director and Luis Sandoval is a Research Assistant at the Center for Economic and Policy Research in Washington, DC. The author would like to thank Dan Beeton and Doug Hertzler for helpful comments. This paper is made available at the CEPR Web site; it is reproduced here for educational purposes.
|
| Print

