The Phenomenal Drain of Profits
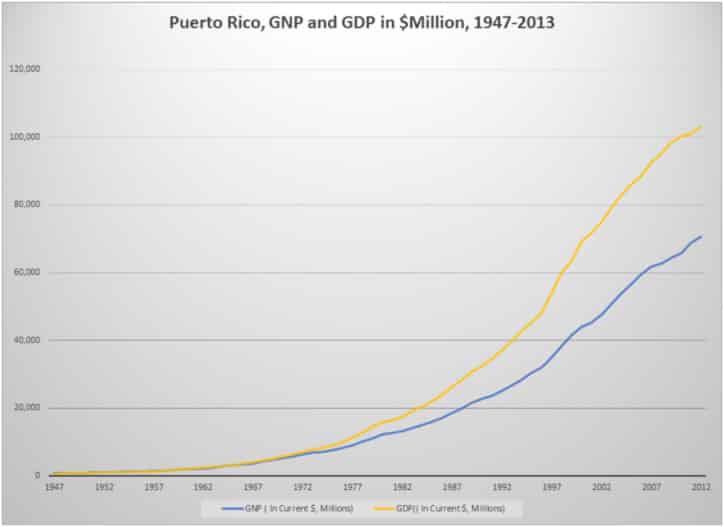
Beginning in the 1970s, Puerto Rico’s economy began to suffer a drain of profits, to the point where the measure of total income produced in the island, the Gross Domestic Product, began to separate dramatically from the measure of income that residents own, the Gross National Product or GNP.
Source: GNP and GDP data is from Puerto Rico Planning Board.
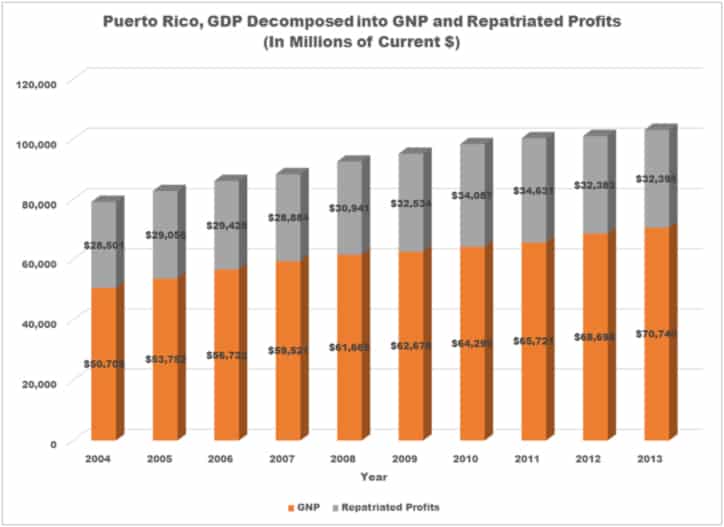
This divergence owes itself to the extraordinary volume of profits that leave Puerto Rico into the hands of the foreign investors that control its economy. A third of the income that is generated in Puerto Rico leaves the country each year in the form of repatriated profits. In other words, the gross National Product of Puerto Rico, or the income that belongs to the residents of the island, is 67% of the total income generated there; the other third is taken away by U.S. corporations.
Source: GNP and GDP data is from Puerto Rico Planning Board.
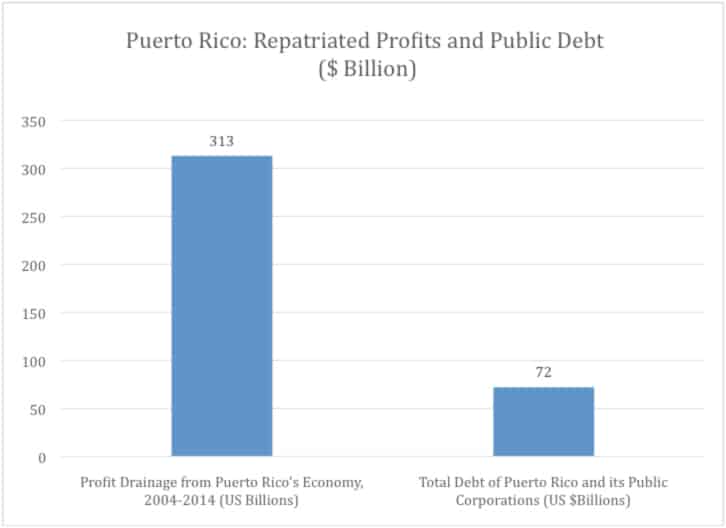
This is a phenomenal drain of resources in an economy controlled primarily by American multinational corporations. In the graph above, the columns represent the Gross Domestic Product of Puerto Rico, broken down into the part belonging to the island’s residents (GNP) and the part of the income that U.S. investors take home in the form of repatriated profits. Puerto Rico’s debt is currently valued at 70 billion dollars; U.S. corporations repatriated 313 billion dollars between 2004 and 2013. To put this drain in perspective, repatriated profits in the last decade alone are enough to pay the entire debt of Puerto Rico’s government and its public corporations four times over!
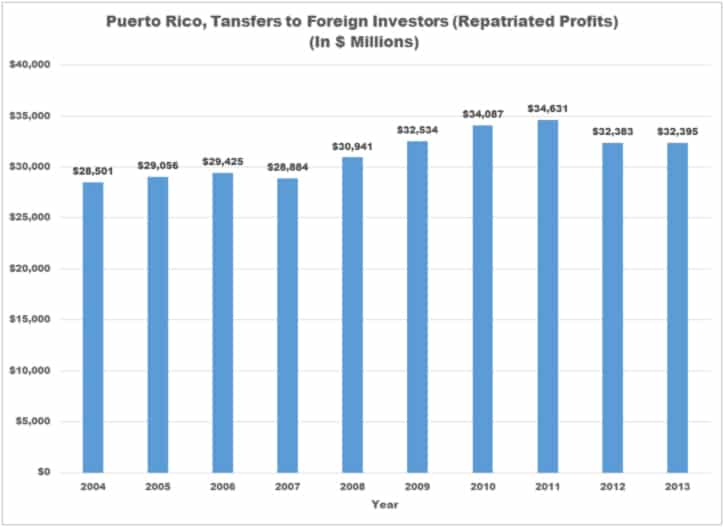
These payments to absentee capital constitute the elephant in the room that is never mentioned in discussions of Puerto Rico’s debt problems. If we take the last decade, the profits earned in two of the last ten years, or an equivalent of 20% in taxes on the total profits generated during that decade, would be enough to leave Puerto Rico free of debt.
Source: GNP and GDP data is from Puerto Rico Planning Board.
An Extraordinary Case
One might think that the case of Puerto Rico is normal with respect to Foreign Direct Investment and the resulting proportion of the income it produces that escapes into the hands of foreign investors. However, this is not the case. Puerto Rico’s situation is exceptional in terms of repatriation of profits and the drain it creates on the local economy. The following table represents GDP and GNP in a number of selected countries. In the worst of these cases, Ireland, extracted profits are not even half of those of Puerto Rico (15 % of the GDP compared to 33% in Puerto Rico).
| Country | Gross Domestic Product (2013)* | Gross National Income (2013)** | GNI as % of GDP | |
| South Africa | $366,057,913,372 | $393,823,024,542 | 108 | |
| Greece | $242,230,732,091 | $249,278,628,645 | 103 | |
| United States | $16,768,053,000,000 | $17,113,833,339,939 | 102 | |
| Spain | $1,393,040,177,014 | $1,395,888,680,016 | 100 | |
| Malaysia | $313,158,247,643 | $309,755,676,019 | 99 | |
| South Korea | $1,305,604,961,393 | $1,298,955,846,781 | 99 | |
| Dominican Republic | $61,198,258,779 | $60,060,832,161 | 98 | |
| Argentina | $622,057,981,847 | $604,738,952,600 | 97 | |
| Chile | $276,673,695,234 | $268,328,882,346 | 97 | |
| Czech Republic | $208,796,024,646 | $199,407,572,904 | 96 | |
| Mexico | $1,262,248,825,556 | $1,209,227,950,661 | 96 | |
| Uruguay | $57,524,653,094 | $53,290,776,344 | 93 | |
| Ireland | $232,077,367,193 | $198,111,832,736 | 85 | |
| Puerto Rico | $103,134,778,000 | $69,432,480,620 | 67 | |
| * Source: data.worldbank.org/indicator/NY.GDP.MKTP.CD/countries | ||||
| ** Source: data.worldbank.org/indicator/NY.GNP.ATLS.CD/countries | ||||
It is well to ask, then, whether Puerto Rico can recover from its debt crisis without confronting the elephant in the room (profit repatriation), that is, without demanding contributions from the corporations that make so much money in the island?
In case anyone doubts that the problem of absentee capital in Puerto Rico is extreme, here is a list of 189 countries with the ratio of GNP/GDP. Puerto Rico ranks 188 of 189! The mean GNP/GDP ratio is 97.32, the Standard Deviation is 8.62, which means that Puerto Rico is 3.5 Standard Deviations below the mean! Z score < .0002 !!!!!!!!!!!!!
| Standard Deviation: |
8.624218 |
| Mean: |
97.32458 |
| How many Standard Deviations below mean is Puerto Rico? |
3.50 |
Puerto Rico is truly a statistical outlier when it comes to the percentage of its GDP that drains out of its economy due to profit repatriation by absentee capital.
| Country | Ratio of GNP to GDP (% in Current Prices): Year 2007 | |
| 1 | Timor-Leste | 431.11 |
| 2 | Kiribati | 157.20 |
| 3 | Lesotho | 126.08 |
| 4 | Marshall Islands | 123.46 |
| 5 | Kuwait | 111.55 |
| 6 | Djibouti | 109.82 |
| 7 | Moldova | 109.63 |
| 8 | Switzerland | 109.22 |
| 9 | Philippines | 109.04 |
| 10 | Micronesia, Fed. Sts. | 107.55 |
| 11 | Bangladesh | 107.47 |
| 12 | Macao | 106.68 |
| 13 | Jordan | 105.10 |
| 14 | Mauritania | 104.00 |
| 15 | Hong Kong | 103.85 |
| 16 | Tonga | 103.55 |
| 17 | Japan | 103.33 |
| 18 | Bosnia and Herzegovina | 103.27 |
| 19 | Bhutan | 102.99 |
| 20 | Albania | 102.78 |
| 21 | Taiwan | 102.63 |
| 22 | Libya | 102.39 |
| 23 | Swaziland | 102.20 |
| 24 | Georgia | 102.20 |
| 25 | Sweden | 102.12 |
| 26 | Netherlands | 102.00 |
| 27 | Paraguay | 101.91 |
| 28 | Denmark | 101.84 |
| 29 | Pakistan | 101.82 |
| 30 | Palau | 101.35 |
| 31 | Niger | 101.16 |
| 32 | Venezuela | 101.12 |
| 33 | Belgium | 101.09 |
| 34 | United Kingdom | 101.04 |
| 35 | Nepal | 101.02 |
| 36 | Mauritius | 100.98 |
| 37 | Germany | 100.97 |
| 38 | China Version 1 | 100.76 |
| 39 | China Version 2 | 100.76 |
| 40 | Finland | 100.69 |
| 41 | Montenegro | 100.68 |
| 42 | United States | 100.55 |
| 43 | France | 100.52 |
| 44 | Egypt | 100.41 |
| 45 | Norway | 100.40 |
| 46 | Kenya | 100.39 |
| 47 | Comoros | 100.31 |
| 48 | Uzbekistan | 100.28 |
| 49 | Korea, Republic of | 100.15 |
| 50 | United Arab Emirates | 100.15 |
| 51 | Ethiopia | 100.07 |
| 52 | Afghanistan | 100.07 |
| 53 | Saudi Arabia | 100.06 |
| 54 | Brunei | 100.00 |
| 55 | Benin | 100.00 |
| 56 | Israel | 99.98 |
| 57 | Romania | 99.88 |
| 58 | Tanzania | 99.68 |
| 59 | Cameroon | 99.62 |
| 60 | India | 99.54 |
| 61 | Sao Tome and Principe | 99.54 |
| 62 | Macedonia | 99.53 |
| 63 | Rwanda | 99.48 |
| 64 | Italy | 99.47 |
| 65 | Central African Republic | 99.40 |
| 66 | Lebanon | 99.36 |
| 67 | Malawi | 99.35 |
| 68 | Eritrea | 99.32 |
| 69 | Burkina Faso | 99.31 |
| 70 | Senegal | 99.21 |
| 71 | Madagascar | 99.20 |
| 72 | Qatar | 99.16 |
| 73 | Canada | 99.13 |
| 74 | Belarus | 99.12 |
| 75 | Guatemala | 99.07 |
| 76 | Ghana | 99.06 |
| 77 | Sri Lanka | 98.94 |
| 78 | Iran | 98.93 |
| 79 | Bulgaria | 98.92 |
| 80 | Solomon Islands | 98.92 |
| 81 | Turkey | 98.91 |
| 82 | Namibia | 98.90 |
| 83 | Algeria | 98.74 |
| 84 | Morocco | 98.70 |
| 85 | Bolivia | 98.68 |
| 86 | Mexico | 98.62 |
| 87 | Kyrgyzstan | 98.60 |
| 88 | Fiji | 98.54 |
| 89 | Guinea | 98.54 |
| 90 | Ukraine | 98.50 |
| 91 | Austria | 98.34 |
| 92 | Togo | 98.26 |
| 93 | Uruguay | 98.24 |
| 94 | Syria | 98.17 |
| 95 | Uganda | 98.10 |
| 96 | Slovenia | 98.03 |
| 97 | Mongolia | 97.99 |
| 98 | Argentina | 97.98 |
| 99 | Sierra Leone | 97.90 |
| 100 | Malaysia | 97.86 |
| 101 | Cuba | 97.84 |
| 102 | Suriname | 97.81 |
| 103 | Nicaragua | 97.72 |
| 104 | Guinea-Bissau | 97.60 |
| 105 | Greece | 97.59 |
| 106 | Russia | 97.56 |
| 107 | Samoa | 97.46 |
| 108 | Spain | 97.43 |
| 109 | Malta | 97.33 |
| 110 | Tajikistan | 97.31 |
| 111 | Turkmenistan | 97.30 |
| 112 | Vietnam | 97.28 |
| 113 | Oman | 97.26 |
| 114 | El Salvador | 97.16 |
| 115 | Bahamas | 97.04 |
| 116 | Cyprus | 96.99 |
| 117 | Croatia | 96.97 |
| 118 | Poland | 96.96 |
| 119 | Costa Rica | 96.96 |
| 120 | Brazil | 96.87 |
| 121 | South Africa | 96.87 |
| 122 | Thailand | 96.83 |
| 123 | Burundi | 96.73 |
| 124 | Cape Verde | 96.57 |
| 125 | Singapore | 96.46 |
| 126 | Latvia | 96.42 |
| 127 | Laos | 96.23 |
| 128 | Colombia | 96.20 |
| 129 | Mali | 96.05 |
| 130 | Indonesia | 96.04 |
| 131 | Congo, Dem. Rep. | 96.02 |
| 132 | Serbia | 95.92 |
| 133 | Lithuania | 95.77 |
| 134 | Slovak Republic | 95.74 |
| 135 | Portugal | 95.71 |
| 136 | Cambodia | 95.69 |
| 137 | Australia | 95.65 |
| 138 | Bahrain | 95.63 |
| 139 | Cote d`Ivoire | 95.62 |
| 140 | Ecuador | 95.40 |
| 141 | Trinidad &Tobago | 95.39 |
| 142 | Iceland | 95.32 |
| 143 | Honduras | 95.10 |
| 144 | Barbados | 95.09 |
| 145 | Tunisia | 94.94 |
| 146 | Dominican Republic | 94.70 |
| 147 | Botswana | 94.68 |
| 148 | Antigua and Barbuda | 94.57 |
| 149 | Maldives | 94.54 |
| 150 | St. Kitts & Nevis | 94.50 |
| 151 | St. Lucia | 94.41 |
| 152 | Yemen | 94.35 |
| 153 | Seychelles | 94.18 |
| 154 | Zimbabwe | 94.12 |
| 155 | Czech Republic | 93.99 |
| 156 | St.Vincent & Grenadines | 93.24 |
| 157 | Panama | 93.19 |
| 158 | Hungary | 93.14 |
| 159 | Vanuatu | 93.05 |
| 160 | New Zealand | 92.83 |
| 161 | Guyana | 92.78 |
| 162 | Gambia, The | 92.73 |
| 163 | Estonia | 92.47 |
| 164 | Peru | 91.92 |
| 165 | Haiti | 91.23 |
| 166 | Somalia | 91.05 |
| 167 | Mozambique | 90.54 |
| 168 | Belize | 90.23 |
| 169 | Sudan | 90.17 |
| 170 | Dominica | 90.09 |
| 171 | Papua New Guinea | 89.68 |
| 172 | Nigeria | 89.50 |
| 173 | Chile | 88.85 |
| 174 | Kazakhstan | 88.42 |
| 175 | Gabon | 88.42 |
| 176 | Zambia | 87.82 |
| 177 | Jamaica | 87.16 |
| 178 | Chad | 86.83 |
| 179 | Ireland | 84.50 |
| 180 | Azerbaijan | 83.75 |
| 181 | Luxembourg | 81.98 |
| 182 | Angola | 79.21 |
| 183 | Congo, Republic of | 78.33 |
| 184 | Liberia | 76.18 |
| 185 | Grenada | 74.58 |
| 186 | Bermuda | 73.27 |
| 187 | Equatorial Guinea | 69.28 |
| 188 | Puerto Rico | 67.15 |
| 189 | Iraq | 64.20 |
| Source: Penn World Tables: datacentre2.chass.utoronto.ca/pwt/ | ||
Puerto Rico is one of only 3 “countries” in the world that lose more than 30% of the income generated within their territories. The other two are Equatorial Guinea and Iraq.
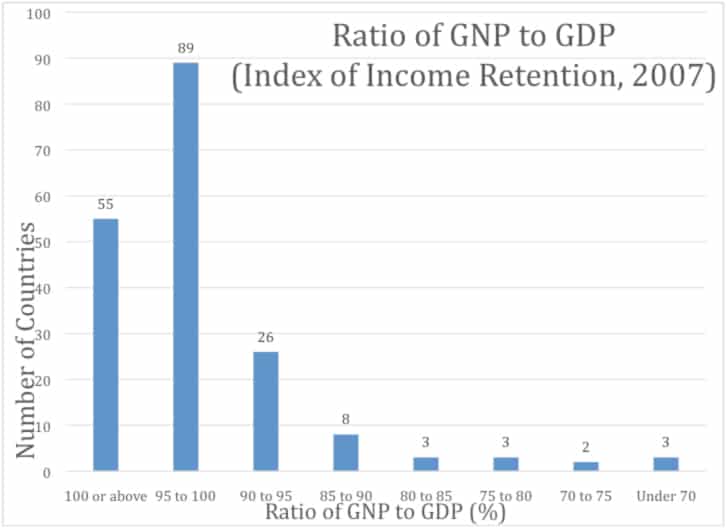
Source: Penn World Tables: datacentre2.chass.utoronto.ca/pwt/
César J. Ayala is Professor of Sociology at the University of California, Los Angeles.

