According to Bloomberg News, analysts at a number of major financial institutions see “mounting evidence” that a recession is not too far away.
In a way, their assessment is not surprising. The current expansion, which started in June 2009, is now 99 months long, making it the third longest expansion in U.S. history. Only the expansions from March 1991 to March 2001 (120 months) and February 1961 to December 1969 (106 months) are longer. It is likely that this expansion will pass the 1960s expansion in length but fall short of the record.
Warning signs
The financial analysts cited by Bloomberg News did not base their warnings simply on longevity. Rather it was the behavior of corporate profits, more specifically their downward trend, that concerned them. Historically, expansions have come to an end because declining profits cause corporations to slash investment spending, which leads to a decline in employment and eventually consumption, and finally recession.
As the Bloomberg article explains, “The gross value-added of non-financial companies after inflation — a measure of the value of goods after adjusting for the costs of production — is now negative on a year-on-year basis.” As an analyst for Oxford Economics Ltd. concludes, “The cycle of real corporate profits has turned enough to be a potential source of concern in the next four quarters.”
Real gross corporate value added is a proxy for profits. Its recent decline, as shown in the figure above, means that corporate profitability is falling over time. As long as it remained positive (the red line was above zero), corporate profits were continuing to grow, just not as fast as they did in the previous year. However, it has now become negative, which means that total profits are actually falling. And, as we can see, whenever this happened in the past, a recession soon followed.
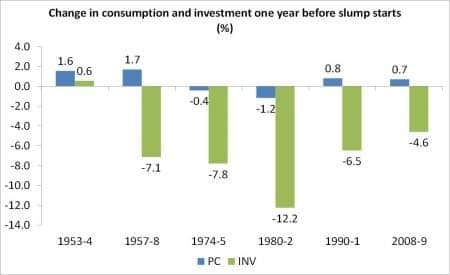
The primary reason recessions follow a decline in profits is that investment decisions are very sensitive to changes in profit. A decline in profit tends to produce a much larger decline in investment, leading to recession. The investment connection to recession is is well illustrated in the following figure, taken from a blog post by the economist Michael Roberts. It shows the change in personal consumption and investment one year before the start of a recession. As we can see, it is the decline in investment that leads the downturn, and the decline takes place more often than not while consumption is still growing.
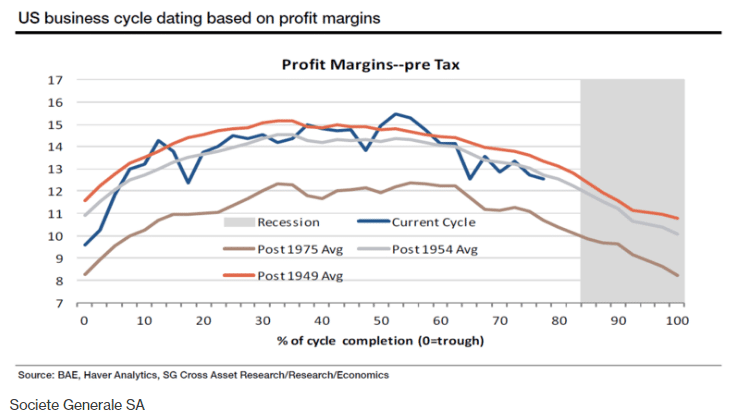
The Bloomberg article highlights other studies that come to the same conclusion about the direction of profits and the growing likelihood of recession. For example, as illustrated below, “The U.S. is in the mature stage of the cycle — 80 percent of completion since the last trough — based on margin patterns going back to the 1950s, according to Societe Generale SA.”
As we can see, the decline in profit margins in the current expansion mirrors the decline during other expansions as they neared their end. It certainly appears that time is running out for this expansion.
Further evidence comes from the recent reduction in corporate buybacks. As the economist William Lazonick explains:
Buybacks have come to define the “investment” strategies of many of America’s biggest businesses. Figure 1 [below] shows net equity issues of U.S. corporations from 1946 to 2014. Net equity issues are new corporate stock issues minus outstanding stock retired through stock repurchases and M&A activity. Since the mid-1980s, in aggregate, corporations have funded the stock market rather than vice versa (as is conventionally assumed). Over the decade 2005-2014 net equity issues of nonfinancial corporations averaged minus $399 billion per year.
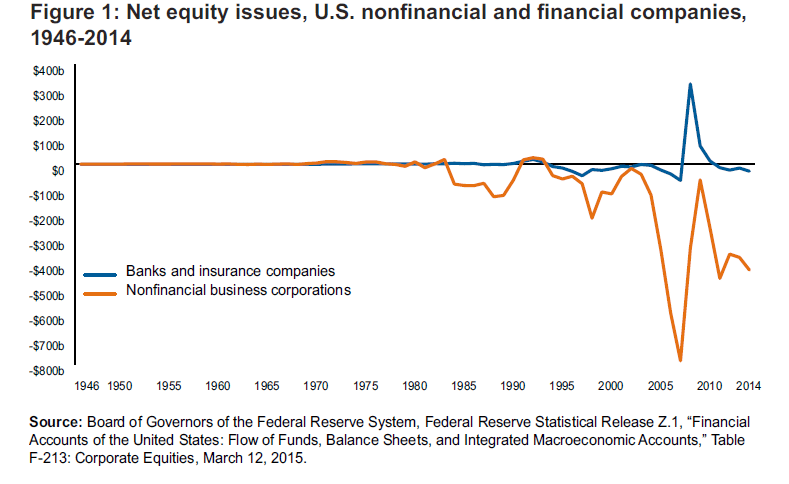
Net equity issues, U.S. nonfinancial and financial companies, 1946–2014. Federal Reserve, Table F-213: Corporate Equities, March 12, 2015.
In other words, corporations have been major players in the stock market, buying and retiring stock in order to drive up stock prices. The process has, by design, enriched the top end of the income distribution. It also helped to boost consumption spending, and by extension the expansion. However, this corporate promotion of stock prices appears to have come to an end. As a Fortune Magazine article reports:
The great stock buyback boom may be on the wane, undermined by falling company earnings.
U.S. company stock buybacks are down 21% in the first seven months of 2016 compared to the same period a year earlier, according to TrimTabs Investment Research, a fall driven in part by five consecutive quarters of year-over-year earnings declines among S&P 500 stocks.
Buybacks, which cancel shares and thus increase per-share earnings, have played a crucial role in supporting the stock market since the financial crisis, flattering earnings even for companies with static or falling revenues.
They, along with dividends, return cash to shareholders, a process often facilitated by borrowed money.
A decline in market values can thus be expected, adding further downward pressure on economic activity.
Social consequences
The business cycle is an inherent feature of capitalist economies and the U.S. economy has experienced many ups and downs. But expansions and recessions do not balance out, leaving the economy on a stable long-term economic trajectory. Unfortunately, while recent cycles have greatly enriched those at the top, working people have generally experienced deteriorating living and working conditions. The trend in job creation is one example.
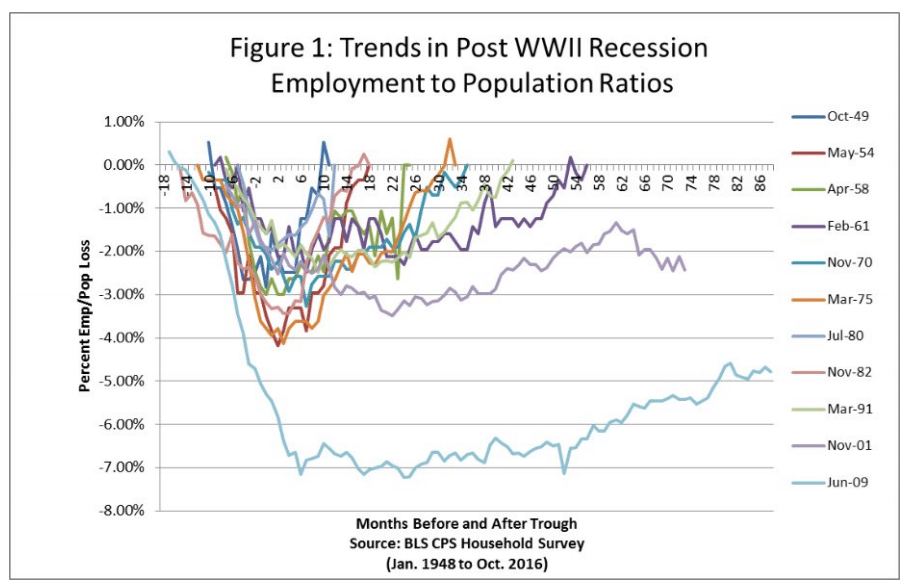
The employment to population ratio is a commonly used measure of employment. It is calculated by dividing the number of people employed by the total working-age population. The figure below, from a report by the Chicago Political Economy Group, shows the relative employment or job creation strength of each post-World War II expansion.
As we can see, the November 2001 expansion ended without restoring the pre-recession employment to population ratio. The ratio was 2.48 percent below where it had been prior to the recession’s start. That means the expansion was not strong enough or structured properly to ensure adequate job creation. And, despite its length, the current expansion’s employment to population ratio remains nearly 5 percent below that lower starting point. Moreover, this employment measure doesn’t take into account that a growing share of the jobs created during this expansion are low-paying and precarious.
In sum, there are strong reasons to expect a recession within the next year or so. And it will likely hit an increasingly vulnerable working class hard. Given trends, where the good times seem to pass most people by and the bad times punish those who gained the least the most, the need for a radical transformation of our economy seems clear.

