Public awareness and acceptance of the negative consequences of corporate-driven globalization on U.S. workers has grown dramatically over the last years, aided in part by Donald Trump’s attacks on trade agreements like NAFTA. Of course, Trump deliberately and misleadingly claims that U.S. corporations have also suffered. And, his tariff-raising actions are an ineffective response to worker difficulties.
Still, many economists continue to argue that the concern over trade is misplaced, that the U.S. manufacturing sector is generally healthy, and it is technology, in particular automation, that is the main reason for the decline in U.S. manufacturing employment.
A new paper by the economist Susan Houseman, “Understanding the Decline of U.S. Manufacturing Employment,” is an effective rebuttal to their arguments. As she concludes:
The widespread denial of domestic manufacturing’s weakness and globalization’s role in its employment collapse has inhibited much-needed, informed debate over trade policies.
What’s up with the manufacturing sector?
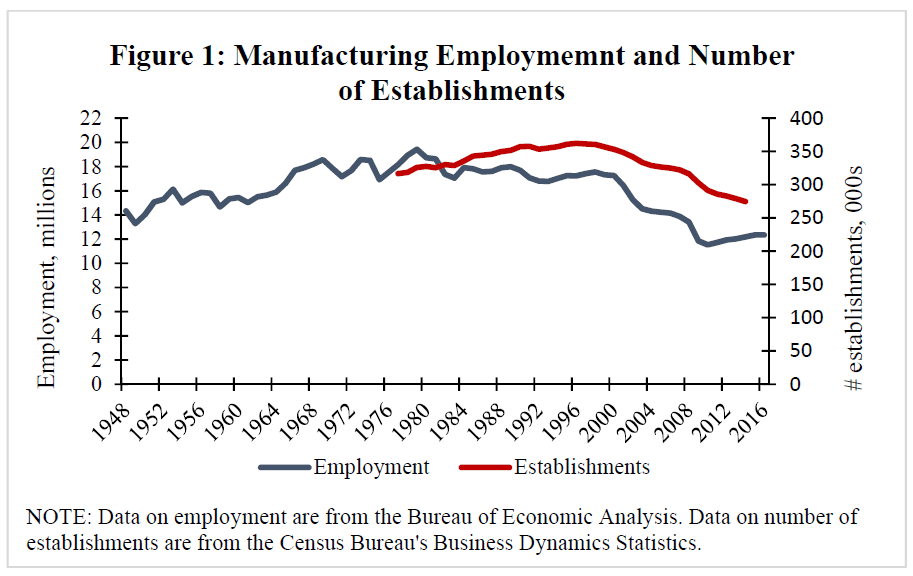
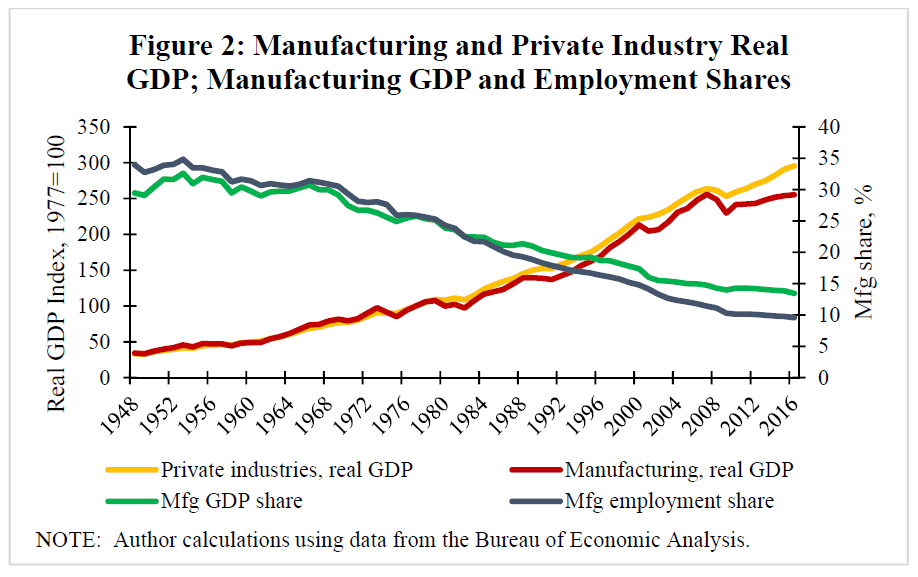
Figure 1 shows that manufacturing employment remained roughly stable from the mid-1960s through the early 1980s, then began a slow decline until 2000, after which it fell dramatically. Figure 2 compares the performance of the manufacturing sector–production and employment–with that of the private sector as a whole. As we can see, the real GDP growth of the manufacturing sector has roughly matched the real GDP growth of the private sector (red and yellow lines; left scale).
Figure 2 also shows that manufacturing’s share of private sector GDP and employment has steadily fallen (green and blue-gray lines; right scale). Manufacturing’s share of private sector GDP peaked at 33 percent in 1953, falling to 13 percent in 2016. Manufacturing’s share of private sector employment peaked at 35 percent, also in 1953, and fell to just under 10 percent in 2016. Those who argue that our manufacturing sector remains healthy do so on the basis of the sector’s relatively strong growth record and the fact that it was achieved with ever fewer workers. As Houseman comments:
Many [research economists] have taken it as strong prima facie evidence that higher productivity growth in manufacturing—implicitly or explicitly assumed to reflect automation—has largely caused the relative and absolute declines of manufacturing employment. Even when some role for trade is recognized, it is deemed small, and the decline is taken as inevitable.
However, there is a bit of a puzzle here. Figure 2 shows that manufacturing GDP growth has generally matched the GDP growth of the entire private sector at the same time that manufacturing’s share of private GDP has steadily fallen. Houseman offers the solution to this puzzle:
If real GDP growth for manufacturing has kept pace with real GDP growth in the aggregate economy yet manufacturing’s share of private sector GDP is falling, then it must be the case that the average price growth of manufactured goods has been slower than the average price growth for the goods and services produced in the economy.
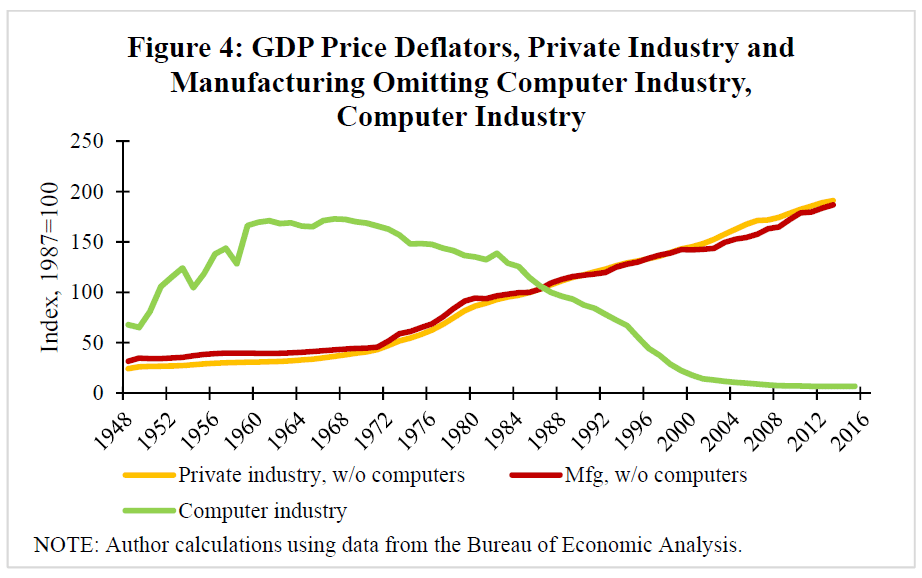
In other words, a relatively slow growth in the price of manufactured goods would boost the real value of the goods produced. At the same time, it would also cause a decline in the manufacturing sector’s share of total output. And, an examination of price deflators shows just such price trends, with the overall price deflator for the private sector steadily rising and the price deflator for manufacturing remaining relatively constant in the post 1980 period. Thus, the strong growth in manufacturing GDP and its related productivity/automation story rests heavily on the striking behavior of the manufacturing price deflator.
And therein lies the problem. Houseman finds that the strong growth in real manufacturing GDP is driven by the price behavior of goods produced by a small subset of manufacturing, namely the computer industry (which she broadens to include semiconductors).
Although the computer industry has accounted for less than 15 percent of value-added in manufacturing throughout the period, it has an outsized effect on measured real output and productivity growth in the sector, skewing these statistics and giving a misleading impression of the health of American manufacturing.
Digging into the data
Figure 4 shows price indices for private industry and manufacturing, omitting the computer industry, and for the computer industry alone. Without the computer industry, the price indices for private industry and manufacturing have largely tracked each other. The computer industry price index, on the other hand, has marched to the beat of a far different drummer. Figure 5 illustrates the importance of the above deflators to the debate about the health of the manufacturing sector. Starting in the mid-1980s we see an ever-greater gap between the real GDP growth of manufacturing without the computer industry (blue-gray line) and the growth of real GDP in the private sector and manufacturing (including the computer industry).
More specifically, “From 1979 to 2000, measured real GDP growth in manufacturing was 97 percent of the average for the private sector; when the computer industry is dropped from both series, manufacturing’s real GDP growth rate is just 45 percent that of the private sector average.” Growth in the manufacturing sector, with the computer industry omitted, has been exceptionally slow over the years 2000 to 2016. Over that period,
Real GDP growth in manufacturing was 63 percent of the average private sector growth. Omitting the computer industry from each series, manufacturing’s measured real output growth is near zero (about 0.2 percent per year) and just 12 percent of the average for the private sector in the 2000s.
So, without the computer industry, manufacturing is clearly struggling. But what explains the strong computer industry performance? As we see next, there is also reason to believe that the computer industry’s performance, and thus its contribution to the manufacturing sector, is also seriously overstated, thereby further undermining claims of manufacturing’s health.
The computer industry
The real GDP of an industry is calculated by dividing the yearly dollar value of industry sales by its price deflator. A real increase in output thus requires that industry sales grow faster than industry prices; if sales double and prices double there is no real gain.
Product quality changes slowly in most industries allowing rather straightforward year to year comparisons of dollar output. However, the computer industry stands as an outlier; for years now, it has produced significantly more powerful products each year. And, on top of that, it has even lowered their prices.
As a result of this unusual behavior, estimating the real growth of the computer industry requires a complicated adjustment of the industry’s price index to account for the yearly increase in computer power and speed. In broad brush the adjustment is handled as follows: If a consumer buys a computer that has 20 percent more computing power than the previous year’s model, the government considers that every 100 new computers produced are the equivalent of 120 of the previous year’s model. The result of such an adjustment is a significant increase in the industry’s output even if the same number of actual computers are produced, an increase that is further magnified by the decline in industry prices.
While it is entirely reasonable to adjust the computer industry’s output for quality when studying the performance of that industry, we have to be careful when the results are used in the calculation of manufacturing’s overall performance. In fact, the computer industry’s rapid gains, based on significant increases in output with declining employment, are misleading as a measure of actual manufacturing activity for two reasons: first, they owe more to difficult-to-measure quality improvements driven by research and development, and second, a growing share of computer industry production has been globalized which means that it takes place outside the country.
As Houseman says, “quality adjustment [for the computer industry] can make the numbers difficult to interpret. Because the computer industry, though small in dollar terms, skews the aggregate manufacturing statistics and has led to much confusion, figures that exclude this industry, as shown in Figure 5, provide a clearer picture of trends in manufacturing output.” And as we can see those trends do not support the claims made that we have a healthy manufacturing sector.
The decline in manufacturing employment
Houseman similarly shows that productivity’s role in the decline in manufacturing employment has also been seriously overstated. As Figure 1, above, makes clear, the number of manufacturing workers has been falling for some time.
From 1979 to 1989 manufacturing lost 1.4 million jobs, with the losses concentrated in the primary metals and textile and apparel industries.
Employment in manufacturing was relatively stable in the 1990s. Although measured employment declined by about 700,000, or 4 percent, from 1989 to 2000, the net decline in jobs can be entirely explained by the [domestic] outsourcing of tasks previously done in-house. . . . Had these workers been counted in manufacturing, manufacturing employment would have risen by an estimated 1.3 percent rather than declining.
As Figure 1 also shows, the explosive decline in manufacturing employment begins in the 2000s. From 2000 to 2007, manufacturing employment fell by 3.4 million, or 20 percent. From 2007 to 2016, manufacturing fell by another 1.5 million. And, of course, this was a period of intensified globalization, perhaps best marked by China’s 2001 entry into the WTO.
Examining the data, Houseman found that average annual employment growth in manufacturing was approximately 2.5 percent lower than the average employment growth in the private sector as a whole over the period 1977 to 2016. Only 15 percent of that differential is accounted for by lower output growth in manufacturing, the rest is explained by higher productivity growth. However,
When the computer industry is omitted from both series, 61 percent of the lower manufacturing employment growth is accounted for by manufacturing’s lower output growth, and just 39 percent by its higher labor productivity growth.
As Housemen comments,
The point of this exercise is to show that there is no prima facie evidence that productivity growth is entirely or primarily responsible for the relative and absolute decline in manufacturing employment.
And there is also reason to question the meaning of the strong computer industry productivity figures. Labor productivity is defined as the value-added of an industry divided by labor input. In the case of the computer industry, the industry’s productivity growth was probably driven most by product improvements, not automation, that boosted its value added. However, global outsourcing of production also made a contribution. While outsourcing reduces the value added of the industry, the decline in labor input is far greater. Thus, it remains unclear how much productivity increases based on the automation of production have actually contributed to the decline in U.S. manufacturing employment, even in the computer industry.
Most importantly, there is a growing body of research that points to globalization as the major factor behind the recent decline in U.S. manufacturing employment. For example, Economists David Autor, David Dorn and Gordon Hanson “conservatively estimate that Chinese import competition explains 16 percent of the U.S. manufacturing employment decline between 1990 and 2000, 26 percent of the decline between 2000 and 2007, and 21 percent of the decline over the full period.” They also find that Chinese import competition “significantly reduces earnings in sectors outside manufacturing.”
In sum, there are good reasons for concern about the health of the U.S. manufacturing sector and opposition to corporate-driven globalization strategies.

