The Bureau of Labor Statistics just published its latest news release on union membership. Unfortunately, the downward trend continues.
The union membership rate—the percent of wage and salary workers in unions—fell in 2018, down to 10.5 percent. That is 0.2 percentage points below what it was in 2017. The number of union members also fell slightly, from 14,817 million in 2017 down to 14,744 million in 2018. By comparison, in 1983, the earliest year with comparable data, the union membership rate was 20.1 percent and there were 17.7 million union members.
Private sector unionized workers still outnumber public sector unionized workers, 7.6 million to 7.2 million. However, public sector workers continue to have a union membership rate more than five times that of private sector workers, 33.9 percent to 6.4 percent. That is a major reason corporate leaders are focusing their anti-union attacks on public sector unions.
The Bureau of Labor Statistics also reported that:
Within the public sector, the union membership rate was highest in local government (40.3 percent), which employs many workers in heavily unionized occupations, such as police officers, firefighters, and teachers. Private-sector industries with high unionization rates included utilities (20.1 percent), transportation and warehousing (16.7 percent), and telecommunications (15.4 percent). Low unionization rates occurred in finance (1.3 percent), food services and drinking places (1.3 percent), and professional and technical services (1.5 percent).
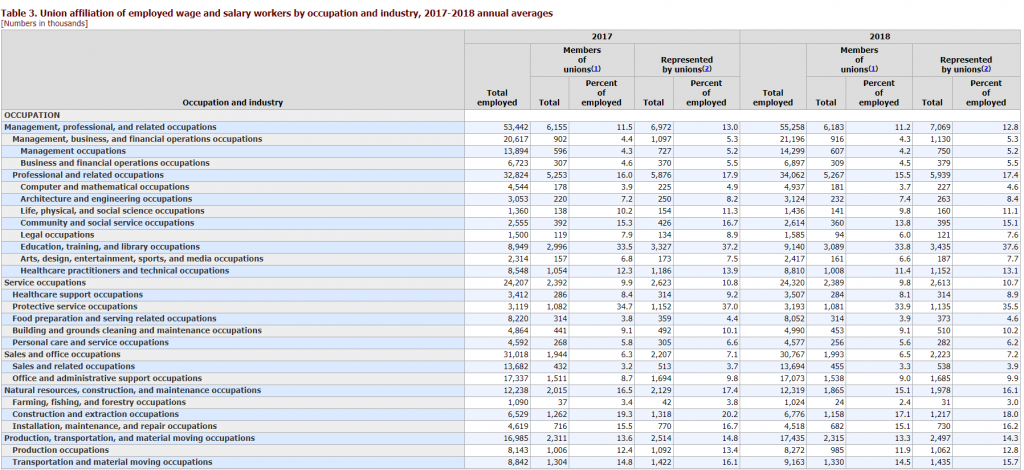
Among occupational groups, the highest unionization rates in 2018 were in protective service occupations (33.9 percent) and in education, training, and library occupations (33.8 percent). Unionization rates were lowest in farming, fishing, and forestry occupations (2.4 percent); sales and related occupations (3.3 percent); computer and mathematical occupations (3.7 percent); and in food preparation and serving related occupations (3.9 percent).
As for earnings, the union difference remains strong. For example, the median weekly earnings of unionized full-time wage and salary workers in 2018 was $1051 compared to $860 for non-unionized full-time wage and salary workers.
Looking at occupations, the median weekly earnings of full-time wage and salary workers in service occupations was $802 for unionized workers and $541 for non-unionized workers. In sales and office occupations, it was $835 for unionized workers and $735 for non-unionized workers. In production, transportation, and material moving occupations, it was $924 for unionized workers and $680 for non-unionized workers. [More complete data is provided in the table below; click on it to enlarge it].
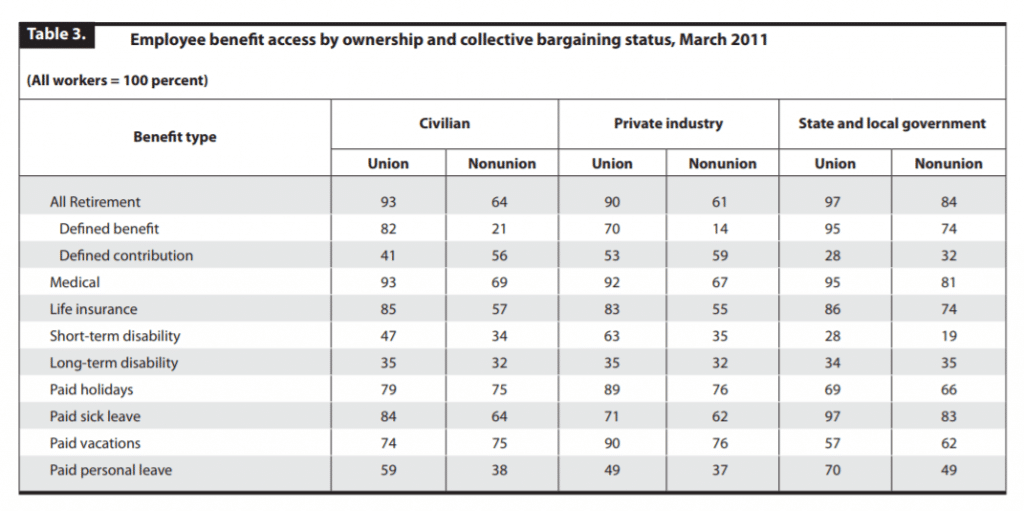
And then there are other benefits. For example, union workers are far more likely to be covered by employer-provided health insurance; enjoy paid sick days and vacations; and, perhaps most importantly, have access to a transparent process that protects them from arbitrary punishment or dismissal. The table below, from a Bureau of Labor Statistics published article, highlights the benefit differential between unionized and non-unionized workers.
Employers never want to pay higher salaries and benefits or cede power to their workers. Therefore, despite their growing profits, they continue to push for new measures designed to weaken unions and worker rights more generally. There are signs of resistance, especially among public sector workers, but there is a long way to go before the balance of power shifts to working people.


