June 2019 marks the 10th anniversary of the current U.S. economic expansion. If it makes it through July it will surpass the 1991-2001 expansion as the longest on record. But while expansions are to be preferred over recessions, there are many reasons to view this record-breaking expansion critically. In fact, the nature of this expansion, hopefully captured in the following portrait, highlights the growing inability of the U.S. economic system, even when performing “well,” to meet majority needs.
Weak Growth
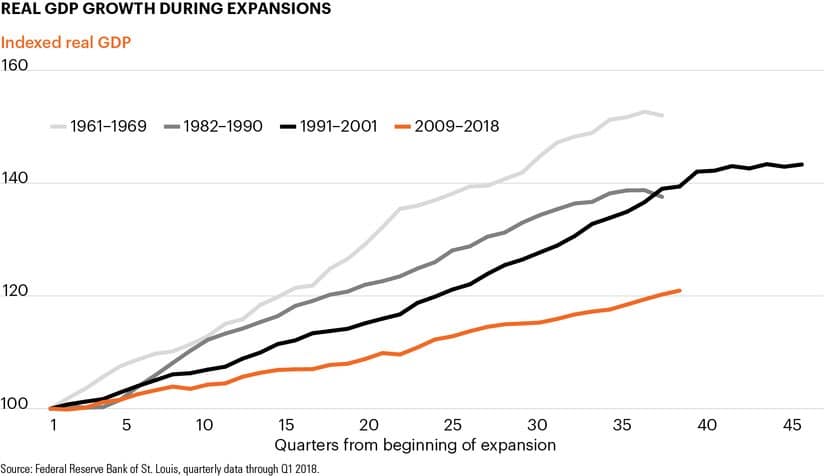
This has been a weak expansion in terms of growth. By way of comparison, GDP grew by 43 percent over the first 39 quarters of the 1991-2001 expansion (which was the previous record holder). In the first 39 quarters of this expansion, through March 2019, GDP grew by only 22 percent.
At its current pace, the current expansion would have to run six more years to equal the aggregate growth of the 1991-2001 expansion, and nine more years to match the 54 percent aggregate GDP growth recorded over the 1961-69 expansion. The figure below illustrates the relative weakness of the current expansion in terms of growth.
Strong corporate profits
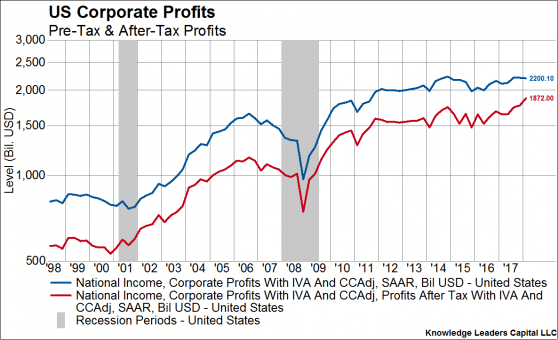
At the same time, weak growth did little to dampen corporate earnings. As we can see in the following figure, corporate earnings have been on the rise since 2001, reaching their maximum in 2015. While pre-tax profits have leveled off, after tax profits, thanks to the recent Trump tax cut, have resumed their upward march.
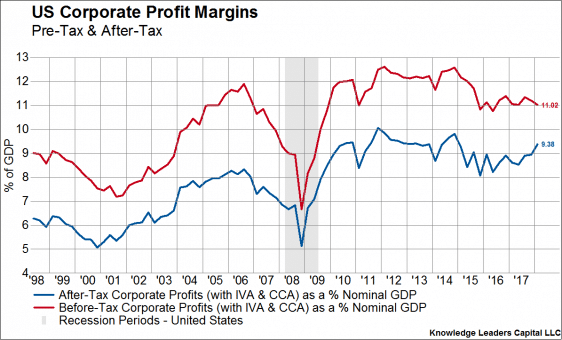
We see a similar trend in the figure below which shows corporate profits as a share of GDP.
After-tax corporate profits will likely turn down again soon, as the effects of the tax cut are already weakening, indicating the end to this expansion is not far off.
Weak wage growth
The suppression of wages is one of the main reasons that corporations were able to enjoy such strong profits despite weak growth. The figure below shows the collapse of labor’s share of corporate income. The trend began during the 2001-2009 expansion but accelerated during this expansion. Even more striking, the share has remained low despite the many years of expansion.
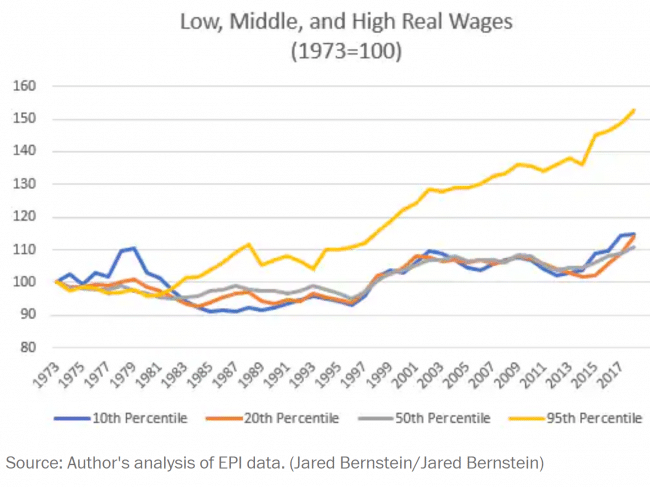
The wage stagnation underlying this trend is illustrated more directly in the next figure.
As we can see, there have been only two recent periods when workers (outside those in the 95th percentile) enjoyed real gains: 1997-2001 and 2015-2017. Both periods were marked by very low rates of unemployment and followed long periods of expansion during which wages remained largely unchanged. It is worth noting that both periods were also marked by a decline in corporate profits, suggesting that corporations cannot long tolerate any kind of upward movement in majority earnings.
For reasons that remain unclear, wage growth in 2019 has slowed. The Federal Reserve Board, always keen to make sure that wages remain low to ensure profitability, began pushing up interest rates in late 2015 in response to the rising wage levels noted above. The recent wage slowdown has, at least temporarily, caused the Fed to halt its interest rate hikes, which will likely help extend the expansion.
Employment struggles
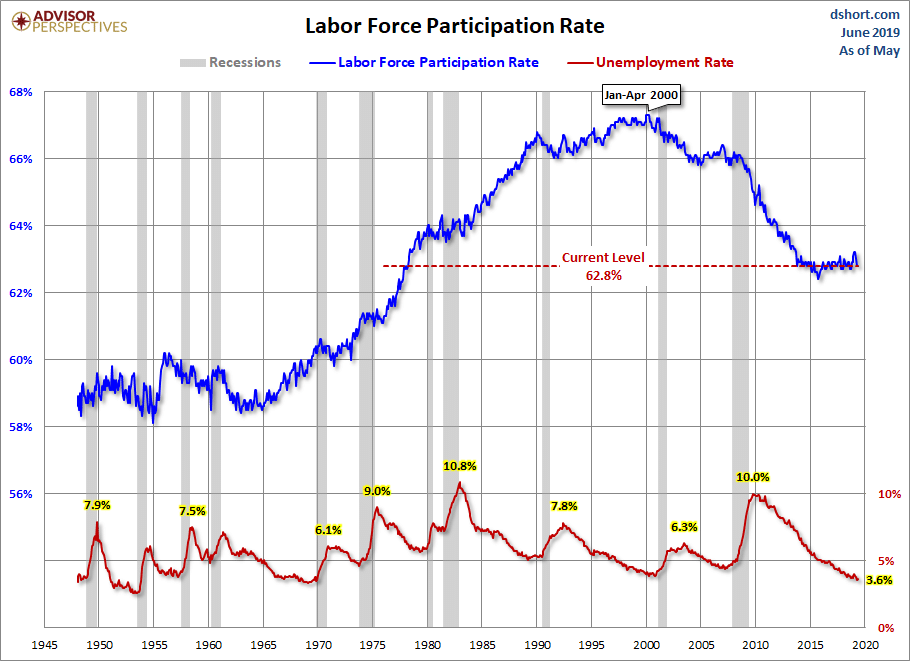
The dramatic decline in unemployment is perhaps the most celebrated achievement of this expansion. As we can see in the figure below, the unemployment rate steadily fell over the expansion, from a high of 10 percent down to a low of 3.6 percent as of May 2019. Such a low level suggests a very tight labor market, which makes the wage stagnation difficult to explain. The likely answer is that the current low level of unemployment is a poor measure of labor tightness.
A better measure appears to be the labor force participation rate, which is calculated as the civilian labor force (i.e., those employed and those unemployed and actively looking for work) divided by the civilian noninstitutional population (i.e., those not in the military or institutionalized). The figure below also shows the labor force participation rate for those 16 years and older.
As we can see, the current labor force participation rate of 62.8 percent remains significantly below its 2008 peak and even further below the even higher peak reached at the turn of the century. The decline in the labor force participation rate means that millions of workers have yet to return to the labor force, either to hold a job or to look for one.
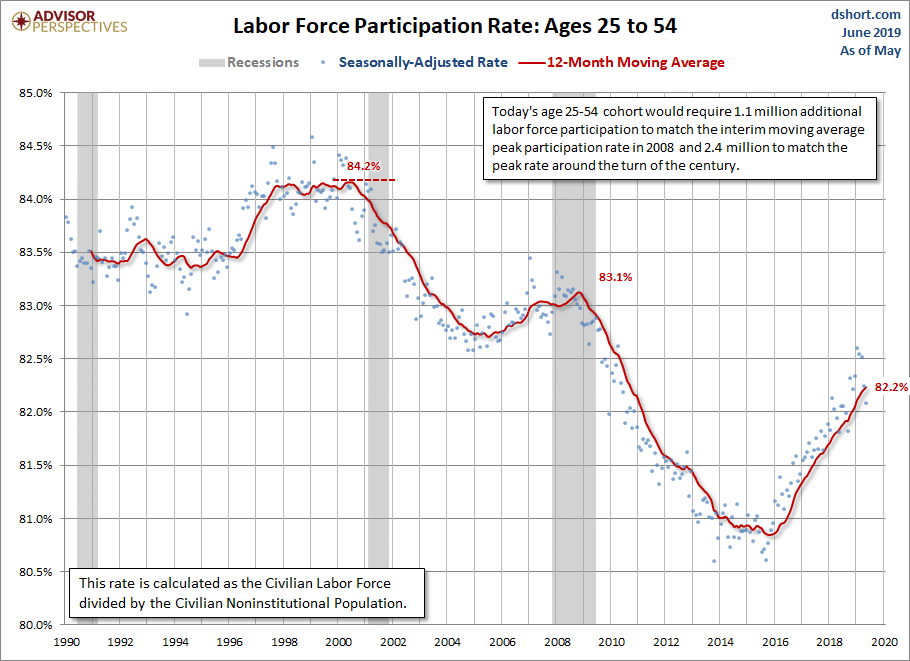
The seriousness of this problem is highlighted by the labor force participation rate of the prime age cohort, those 25-54 years of age. Their core status stems from the fact that, as Jill Mislinski explains,
This cohort leaves out the employment volatility of the high-school and college years, the lower employment of the retirement years and also the age 55-64 decade when many in the workforce begin transitioning to retirement…for example, two-income households that downsize into one-income households.
In the figure below we can see that the labor force participation rate of the prime age cohort remains significantly below its two previous peaks. The fact that millions of prime age workers have yet to return to the labor market is a strong indicator that labor market conditions remain far from ideal despite years of economic expansion.
Weak Investment
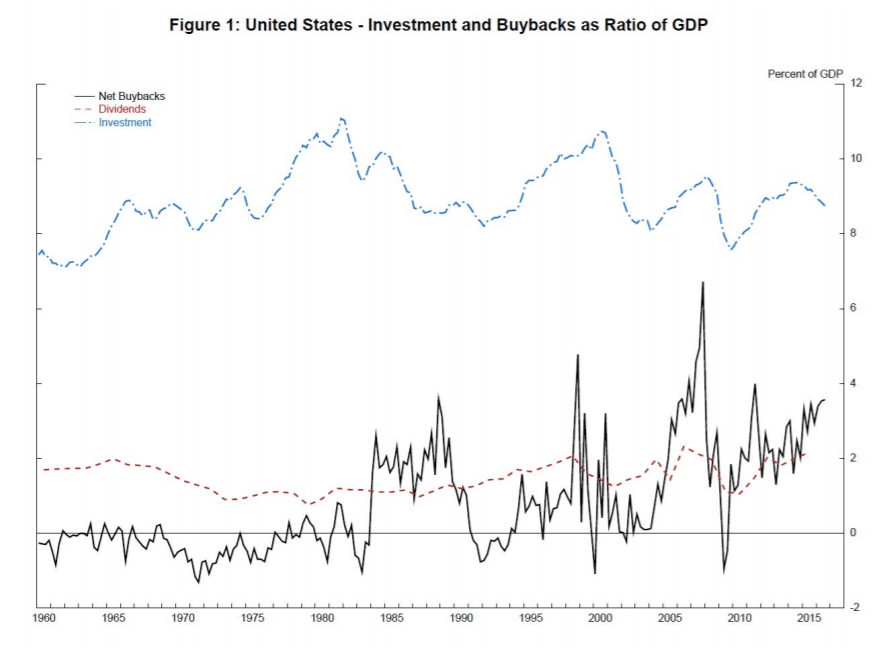
One reason for the slow growth and associated weak job creation is that business has been reluctant to invest. Instead, they have been content to use a growing share of their earnings to fund dividend payments and stock buybacks. The following chart, taken from a Federal Reserve Board study of the relationship between corporate capital investment and net stock buybacks, shows a post-2000 downward trend in business investment as a share of GDP and a rise in the value of dividend payments and stock buybacks as a share of GDP.
While the Federal Reserve study concludes that it is difficult to determine whether “corporations are actively reducing investment in order to finance share repurchases and dividend payments . . . [or] pessimism about future demand and economic growth is leading corporations to defer capital spending, and companies are simply returning cash to their shareholders for want of attractive investment opportunities,” there can be no question that there has been a noticeable change in business behavior.
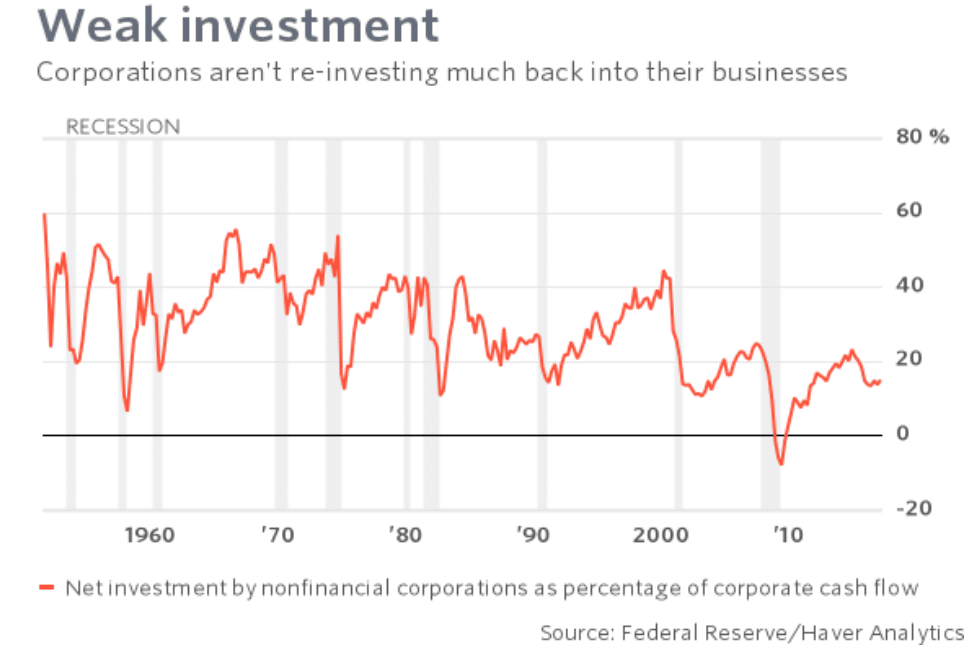
For example, as can see below, whereas in the past nonfinancial corporations invested up to 40 percent of their cash flow back into their business, that share has fallen below 20 percent for most of the current expansion. In other words, the lack of investment has nothing to do with a shortage of funds.
As the Federal Reserve study points out, business has been funneling ever more of its earnings, through dividends and stock buybacks, to its top managers and stockholders. According to the New York Times, “From 2008 to 2017, 466 S.&P. 500 companies distributed $4 trillion to shareholders as buybacks, equal to 53 percent of profits, along with $3.1 trillion as dividends.” Beyond slowing growth and job creation, such a policy has helped to drive income and wealth inequality to record levels, ensuring that those at the top remain content with the economy’s performance despite the problems faced by most working people.
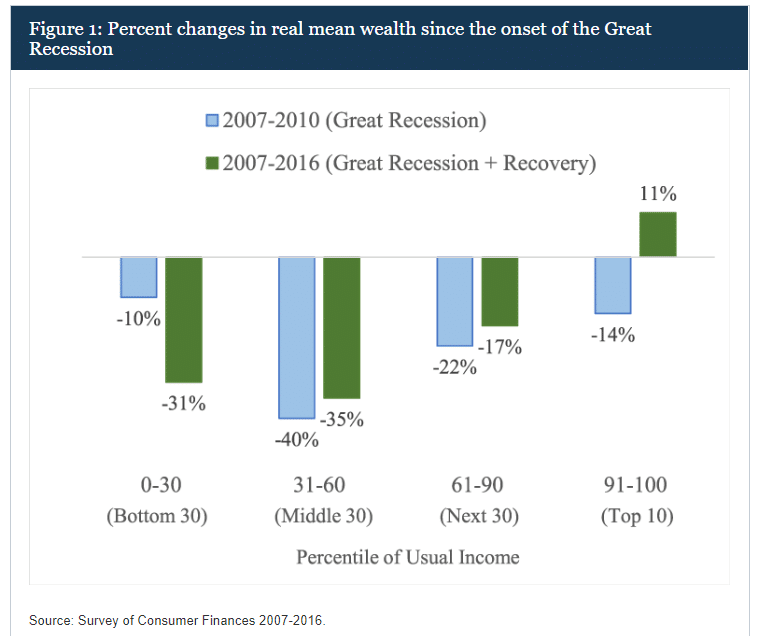
The following figure, from another Federal Reserve Board study, this one titled A Wealthless Recovery?, highlights the extremely uneven distribution of rewards during this expansion. The authors of the report grouped working-age households into four different groups according to their reported “usual income.” As we can see from the blue bars, the Great Recession left all groups with substantially less wealth. However, as we can see from the green bars, which extend the period under analysis to 2016, (which includes many years of expansion), only the top income group enjoys a gain in wealth. In other words, the expansion has done little to help the bottom 90 percent of working-age households recover the wealth they lost during the Great Recession.
Austerity
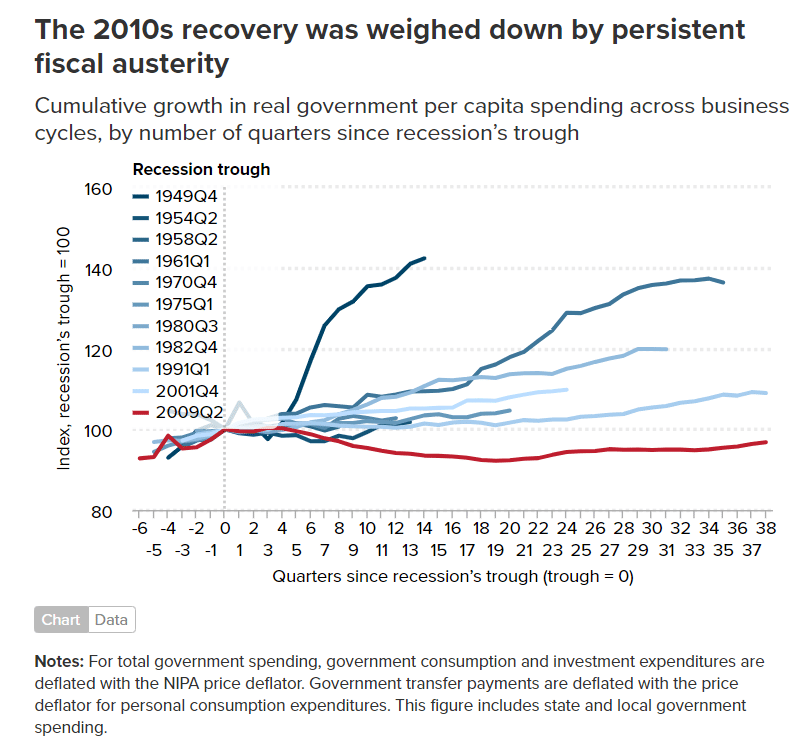
Sustained fiscal austerity is another reason for the slow growth during this expansion. The figure below shows the cumulative growth in per capita spending by federal, state, and local governments following the troughs of the 11 recessions since World War II. As Josh Bivens explains:
Astoundingly, per capita government spending in the first quarter of 2016—twenty-seven quarters into the recovery—was nearly 4.9 percent lower than at the trough of the Great Recession. By contrast, 27 quarters into the early 1990s recovery, per capita government spending was 3.6 percent higher than at the trough; 24 quarters after the early 2000s recession (a shorter recovery that did not last a full 27 quarters), it was almost 10 percent higher; and 27 quarters into the early 1980s recovery, it was more than 17 percent higher.
If government spending in this expansion had followed the pattern of previous recoveries, public spending would have been far greater, not only boosting demand and employment but ensuring provision of needed public services. As Bivens points out,
If government spending following the Great Recession’s end had tracked the spending that followed the early 1980s recession—the only other postwar recession of similar magnitude—governments in 2016 would have been spending almost a trillion dollars more in that year alone.
State and local governments are primarily responsible for this austerity. In many cases, their actions were the result of tax cuts enacted to benefit the wealthy and leading corporations that left state and local governments short of revenue. Limited by balanced budget requirements, most ended up slashing spending on social services. As a consequence, the brunt of austerity has been borne by working people.
Summing up
This is far from a complete portrait of the current expansion. Yet, it still clearly reveals how the logic of capitalism works against the interests of the great majority of working people, even during a long period of profitable economic activity. A recession awaits, and then our troubles will intensify. Key to our ability to build a popular democratic response in defense of majority interests may well be how people evaluate the benefits of remaining committed to an economic system that that undermines their well-being in multiple ways even when it is functioning well.


