Introduction
This is the tenth edition of the United Nations Environment Programme (UNEP) Emissions Gap Report. It provides the latest assessment of scientific studies on current and estimated future greenhouse gas (GHG) emissions and compares these with the emission levels permissible for the world to progress on a least-cost pathway to achieve the goals of the Paris Agreement. This difference between “where we are likely to be and where we need to be” has become known as the ‘emissions gap’.
Reflecting on the ten-year anniversary, a summary report, entitled Lessons from a decade of emissions gap assessments, was published in September for the Secretary- General’s Climate Action Summit.
The summary findings are bleak. Countries collectively failed to stop the growth in global GHG emissions, meaning that deeper and faster cuts are now required. However, behind the grim headlines, a more differentiated message emerges from the ten-year summary. A number of encouraging developments have taken place and the political focus on the climate crisis is growing in several countries, with voters and protestors, particularly youth, making it clear that it is their number one issue. In addition, the technologies for rapid and cost-effective emission reductions have improved significantly.
As in previous years, this report explores some of the most promising and applicable options available for countries to bridge the gap, with a focus on how to create transformational change and just transitions. Reflecting on the report’s overall conclusions, it is evident that incremental changes will not be enough and there is a need for rapid and transformational action.
The political context in 2019 has been dominated by the United Nations Secretary-General’s Global Climate Action Summit, which was held in September and brought together governments, the private sector, civil society, local authorities and international organizations.
The aim of the Summit was to stimulate action and in particular to secure countries’ commitment to enhance their nationally determined contributions (NDCs) by 2020 and aim for net zero emissions by 2050.
According to the press release at the end of the Summit, around 70 countries announced their intention to submit enhanced NDCs in 2020, with 65 countries and major subnational economies committing to work towards achieving net zero emissions by 2050. In addition, several private companies, finance institutions and major cities announced concrete steps to reduce emissions and shift investments into low-carbon technologies. A key aim of the Summit was to secure commitment from countries to enhance their NDCs, which was met to some extent, but largely by smaller economies. With most of the G20 members visibly absent,the likely impact on the emissions gap will be limited.
As regards the scientific perspective, the Intergovernmental Panel on Climate Change (IPCC) issued two special reports in 2019: the Climate Change and Land report on climate change, desertification, land degradation, sustainable land management, food security and greenhouse gas fluxes in terrestrial ecosystems, and the Ocean and Cryosphere in a Changing Climate report. Both reports voice strong concerns about observed and predicted changes resulting from climate change and provide an even stronger scientific foundation that supports the importance of the temperature goals of the Paris Agreement and the need to ensure emissions are on track to achieve these goals.
This Emissions Gap Report has been prepared by an international team of leading scientists, assessing all available information, including that published in the context of the IPCC special reports, as well as in other recent scientific studies. The assessment production process has been transparent and participatory. The assessment methodology and preliminary findings were made available to the governments of the countries specifically mentioned in the report to provide them with the opportunity to comment on the findings.
1. GHG emissions continue to rise, despite scientific warnings and political commitments.
▶ GHG emissions have risen at a rate of 1.5 per cent per year in the last decade, stabilizing only briefly between 2014 and 2016. Total GHG emissions, including from land-use change, reached a record high of 55.3 GtCO2e in 2018.
▶ Fossil CO 2 emissions from energy use and industry, which dominate total GHG emissions, grew 2.0 per cent in 2018, reaching a record 37.5 GtCO2 per year.
▶ There is no sign of GHG emissions peaking in the next few years; every year of postponed peaking means that deeper and faster cuts will be required. By 2030, emissions would need to be 25 per cent and 55 per cent lower than in 2018 to put the world on the least-cost pathway to limiting global warming to below 2˚C and 1.5°C respectively.
▶ Figure ES.1 shows a decomposition of the average annual growth rates of economic activity (gross domestic product–GDP), primary energy use, energy use per unit of GDP, CO2 emissions per unit of energy and GHG emissions from all sources for Organisation for Economic Co-operation and Development (OECD) and non-OECD members.
▶ Economic growth has been much stronger in non-OECD members, growing at over 4.5 per cent per year in the last decade compared with 2 per cent per year in OECD members. Since OECD and non-OECD members have had similar declines in the amount of energy used per unit of economic activity, stronger economic growth means that primary energy use has increased much faster in non-OECD members (2.8 per cent per year) than in OECD members (0.3 per cent per year).
▶ OECD members already use less energy per unit of economic activity, which suggests that non- OECD members have the potential to accelerate improvements even as they grow, industrialize and urbanize their economies in order to meet development objectives.
▶ While the global data provide valuable insight for understanding the continued growth in emissions, it is necessary to examine the trends of major emitters to gain a clearer picture of the underlying trends (figure ES.2). Country rankings change dramatically when comparing total and per capita emissions: for example, it is evident that China now has per capita emissions in the same range as the European Union (EU) and is almost at a similar level to Japan.
▶ Consumption-based emission estimates, also known as a carbon footprint, that adjust the standard territorial emissions for imports and exports, provide policymakers with a deeper insight into the role of consumption, trade and the interconnectedness of countries. Figure ES.3 shows that the net flow of embodied carbon is from developing to developed countries, even as developed countries reduce their territorial emissions this effect is being partially offset by importing embodied carbon, implying for example that EU per capita emissions are higher than Chinese when consumption-based emissions are included. It should be noted that consumption- based emissions are not used within the context of the United Nations Framework Convention on Climate Change (UNFCCC).
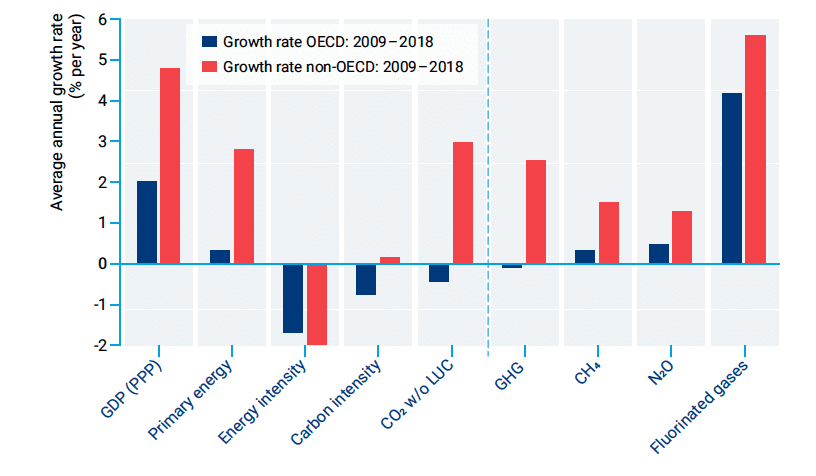
Figure ES.1. Average annual growth rates of key drivers of global CO2 emissions (left of dotted line) and components of
greenhouse gas emissions (right of dotted line) for OECD and non-OECD members.
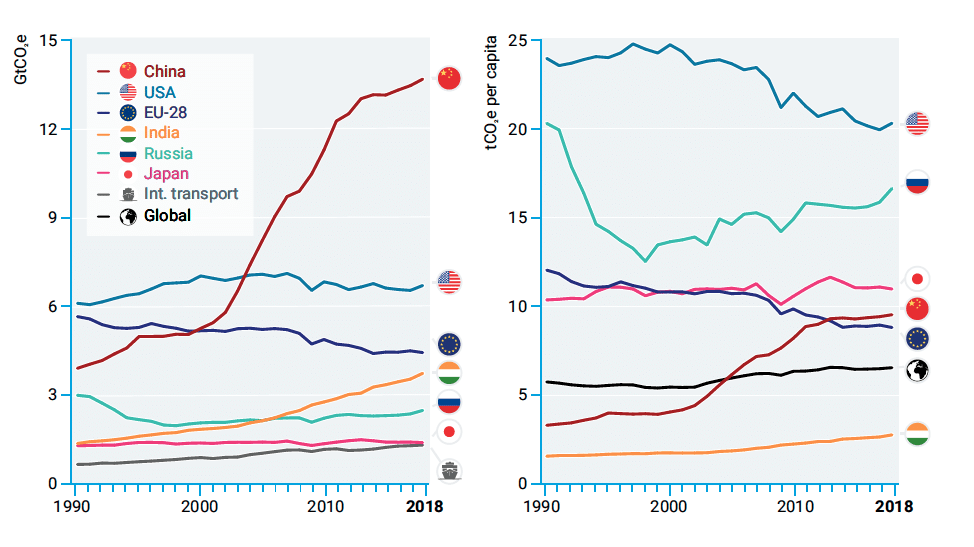
Figure ES.2. Top greenhouse gas emitters, excluding land-use change emissions due to lack of reliable country-level data,
on an absolute basis (left) and per capita basis (right).
2. G20 members account for 78 per cent of global GHG emissions. Collectively, they are on track to meet their limited 2020 Cancun Pledges, but seven countries are currently not on track–to meet 2030 NDC commitments, and for a further three, it is not possible to say.
▶ As G20 members account for around 78 per cent of global GHG emissions (including land use), they largely determine global emission trends and the–extent to which the 2030 emissions gap will be closed. This report therefore pays close attention to G20 members.
▶ G20 members with 2020 Cancun Pledges are collectively projected to overachieve these by about 1 GtCO2e per year. However, several individual G20 members (Canada, Indonesia, Mexico, the Republic of Korea, South Africa, the United States of America) are currently projected to miss their Cancun Pledges or will not achieve them with great certainty. Argentina, Saudi Arabia and Turkey have not made 2020 pledges and pledges from several countries that meet their targets are rather unambitious.
▶ Australia is carrying forward their overachievement from the Kyoto period to meet their 2020 Cancun Pledge and counts cumulative emissions between–2013 and 2020. With this method, the Australian Government projects that the country will overachieve its 2020 pledge. However, if this ‘carry forward’ approach is not taken, Australia will not–achieve its 2020 pledge.
▶ On the progress of G20 economies towards their NDC targets, six members (China, the EU28, India, Mexico, Russia and Turkey) are projected to meet their unconditional NDC targets with current policies. Among them, three countries (India, Russia and Turkey) are projected to be more than 15 per cent lower than their NDC target emission levels. These results suggest that the three countries have room to raise their NDC ambition significantly. The EU28 has introduced climate legislation that achieves at least a 40 per cent reduction in GHG emissions, which the European Commission projects could be overachieved if domestic legislation is fully implemented in member states.
▶ In contrast, seven G20 members require further action of varying degree to achieve their NDC: Australia, Brazil, Canada, Japan, the Republic of Korea, South Africa and the United States ofAmerica. For Brazil, the emissions projections from three annually updated publications were all revised upward, reflecting the recent trend towards increased deforestation, among others. In Japan, however, current policy projections have been close to achieving its NDC target for the last few years.
▶ Studies do not agree on whether Argentina, Indonesia and Saudi Arabia are on track to meet their unconditional NDCs. For Argentina, recent domestic analysis that reflects the most recent GHG inventory data up to 2016 projects that the country will achieve its unconditional NDC target, while two international studies project that it will fall short of its target. For Indonesia, this is mainly due to uncertainty concerning the country’s land use, land use change and forestry (LULUCF) emissions. For Saudi Arabia, the limited amount of information on the country’s climate policies has not allowed for further assessments beyond the two studies reviewed.
▶ Some G20 members are continuously strengthening their mitigation policy packages, leading to a downward revision of current policy scenario projections for total emissions over time. One example is the EU, where a noticeable downward shift has been observed in current policy scenario projections for 2030 since the 2015 edition of the Emissions Gap Report.
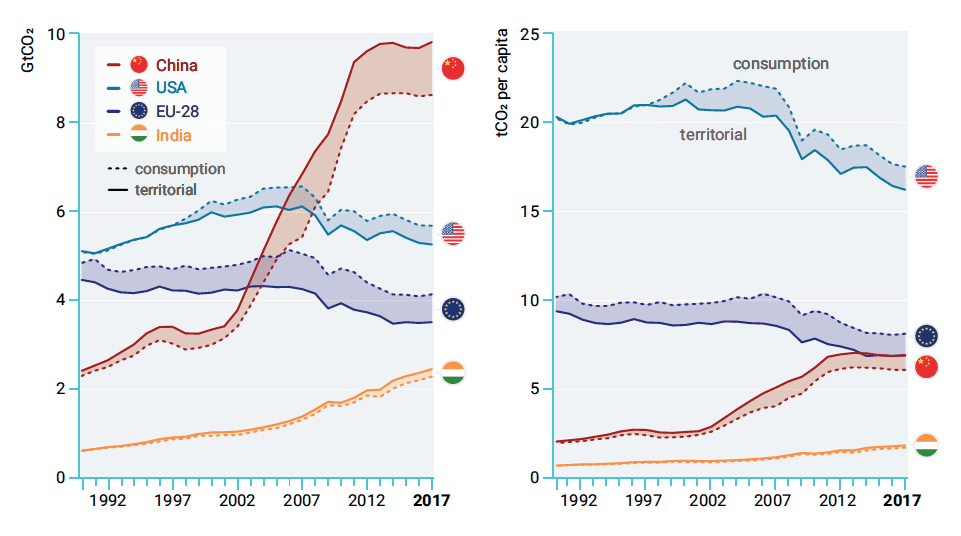
Figure 2.4 a+b — CO2 emissions allocated to the point of emissions (territorial) and the point of consumption,
for absolute emissions (left) and for per capita (right).
3. Although the number of countries announcing net zero GHG emission targets for 2050 is increasing, only a few countries have so far formally submitted long term strategies to the UNFCCC.
▶ An increasing number of countries have set net zero emission targets domestically and 65 countries and major subnational economies, such as the region of California and major cities worldwide, have committed to net zero emissions by 2050. However, only a few long term strategies submitted to the UNFCCC have so far committed to a timeline for net zero emissions, none of which are from a G20 member.
▶ Five G20 members (the EU and four individual members) have committed to long term zero emission targets, of which three are currently in the process of passing legislation and two have recently passed legislation. The remaining 15 G20 members have not yet committed to zero emission targets.
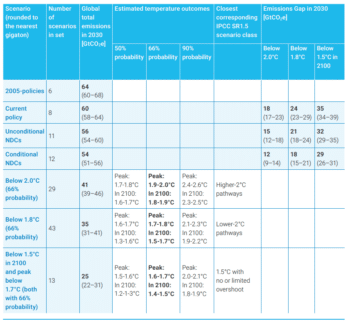
Table ES.1. Global total GHG emissions by 2030 under different scenarios (median and 10th to 90th percentile range), temperature implications and the resulting emissions gap.
4. The emissions gap is large. In 2030, annual emissions need to be 15 GtCO2e lower than current unconditional NDCs imply for the 2°C goal, and 32 GtCO2e lower for the 1.5°C goal.
▶ Estimates of where GHG emissions should be in 2030 in order to be consistent with a least-cost pathway towards limiting global warming to the specific temperature goals have been calculated from the scenarios that were compiled as part of the mitigation pathway assessment of the IPCC Special Report on Global Warming of 1.5°C report.
▶ This report presents an assessment of global emissions pathways relative to those consistent with limiting warming to 2°C, 1.8°C and 1.5°C, in order to provide a clear picture of the pathways that will keep warming in the range of 2°C to 1.5°C. The report also includes an overview of the peak and 2100 temperature outcomes associated with different likelihoods. The inclusion of the 1.8°C level allows for a more nuanced interpretation and discussion of the implication of the Paris Agreement’s temperature targets for near-term emissions.
▶ The NDC scenarios of this year’s report are based on updated data from the same sources used for the current policies scenario and is provided by 12 modeling groups. Projected NDC levels for some countries, in particular China and India, depend on recent emission trends or GDP growth projections that are easily outdated in older studies. Thus, studies that were published in 2015, before the adoption of the Paris Agreement, have been excluded in this year’s update. Excluding such studies has had little impact on the projected global emission levels of the NDC scenarios, which are very similar to those presented in the UNEP Emissions Gap Report 2018.
▶ With only current policies, GHG emissions are estimated to be 60 GtCO2e in 2030. On a least-cost pathway towards the Paris Agreement goals in 2030, median estimates are 41 GtCO2e for 2°C, 35 GtCO2e for 1.8°C, and 25 GtCO2e for 1.5°C.
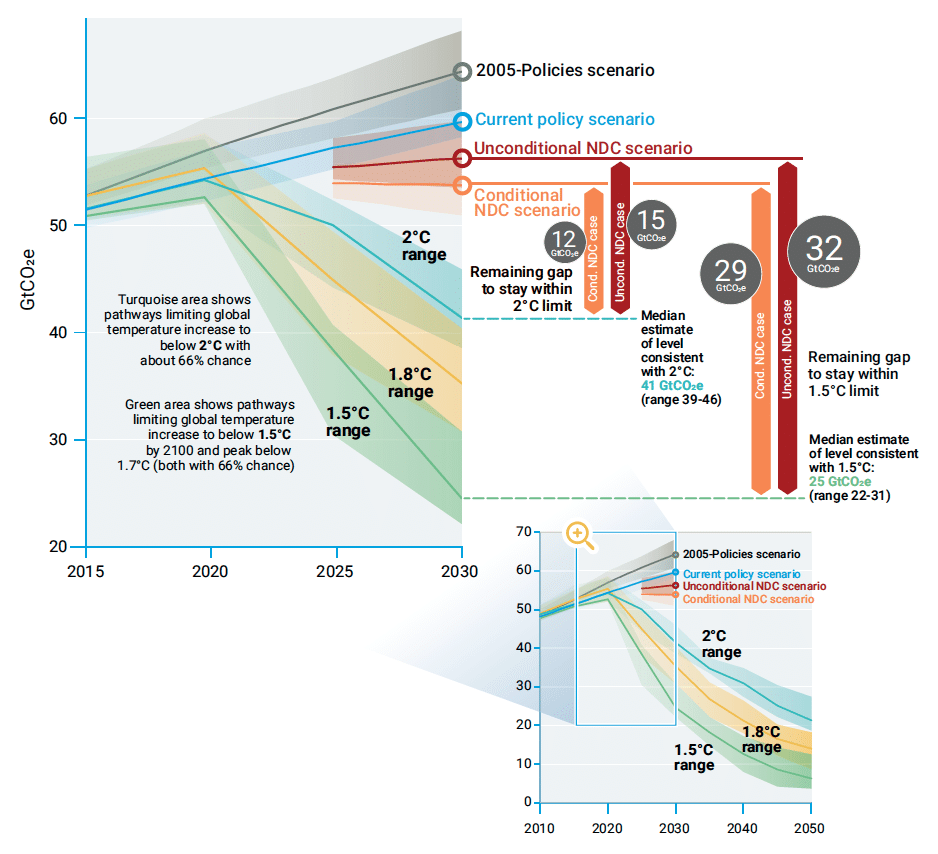
Figure ES.4. Global GHG emissions under different scenarios and the emissions gap by 2030.
▶ If unconditional and conditional NDCs are fully implemented, global emissions are estimated to reduce by around 4 GtCO2e and 6 GtCO2e respectively by 2030, compared with the current policy scenario.
▶ The emissions gap between estimated total global emissions by 2030 under the NDC scenarios and under pathways limiting warming to below 2°C and 1.5°C is large (see Figure ES.4). Full implementation of the unconditional NDCs is estimated to result in a gap of 15 GtCO2e (range: 12–18 GtCO2e) by 2030, compared with the 2°C scenario. The emissions gap between implementing the unconditional NDCs and the 1.5°C pathway is about 32 GtCO2e (range: 29–35 GtCO2e).
▶ The full implementation of both unconditional and conditional NDCs would reduce this gap by around 2–3 GtCO2e.
▶ If current unconditional NDCs are fully implemented, there is a 66 per cent chance that warming will be limited to 3.2°C by the end of the century. If conditional NDCs are also effectively implemented, warming will likely reduce by about 0.2°C.
5. Dramatic strengthening of the NDCs is needed in 2020. Countries must increase their NDC ambitions threefold to achieve the well below 2°C goal and more than fivefold to achieve the 1.5°C goal.
▶ The ratchet mechanism of the Paris Agreement foresees strengthening of NDCs every five years. Parties to the Paris Agreement identified 2020 as a critical next step in this process, inviting countries to communicate or update their NDCs by this time. Given the time lag between policy decisions and associated emission reductions, waiting until 2025 to strengthen NDCs will be too late to close the large 2030 emissions gap.
▶ The challenge is clear. The recent IPCC special reports clearly describe the dire consequences of inaction and are backed by record temperatures worldwide along with enhanced extreme events.
▶ Had serious climate action begun in 2010, the cuts required per year to meet the projected emissions levels for 2°C and 1.5°C would only have been 0.7 per cent and 3.3 per cent per year on average. However, since this did not happen, the required cuts in emissions are now 2.7 per cent per year from 2020 for the 2°C goal and 7.6 per cent per year on average for the 1.5°C goal. Evidently, greater cuts will be required the longer that action is delayed.
▶ Further delaying the reductions needed to meet the goals would imply future emission reductions and removal of CO2 from the atmosphere at such a magnitude that it would result in a serious deviation from current available pathways. This, together with necessary adaptation actions, risks seriously damaging the global economy and undermining food security and biodiversity.
6. Enhanced action by G20 members will be essential for the global mitigation effort.
▶ This report has a particular focus on the G20 members, reflecting on their importance for global mitigation efforts. Chapter 4 in particular focuses on progress and opportunities for enhancing mitigation ambition of seven selected G20 members–Argentina, Brazil, China, the EU, India, Japan and the United States of America–which represented around 56 per cent of global GHG emissions in 2017. The chapter, which was pre-released for the Climate Action Summit, presents a detailed assessment of action or inaction in key sectors, demonstrating that even though there are a few frontrunners, the general picture is rather bleak.
▶ In 2009, the G20 members adopted a decision to gradually phase out fossil-fuel subsidies, though no country has committed to fully phasing these out by a specific year as yet.
▶ Although many countries, including most G20 members, have committed to net zero deforestation targets in the last few decades, these commitments are often not supported by action on the ground.
▶ Based on the assessment of mitigation potential in the seven previously mentioned countries, a number of areas have been identified for urgent and impactful action (see table ES.2). The purpose of the recommendations is to show potential, stimulate engagement and facilitate political discussion of what is required to implement the necessary action. Each country will be responsible for designing their own policies and actions.
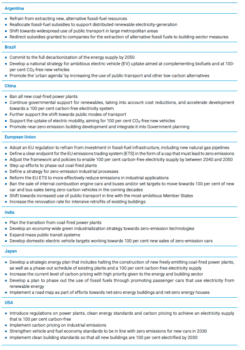
Table ES.2. Selected current opportunities to enhance ambition in seven G20 members in line with ambitious climate actions and targets.
7. Decarbonizing the global economy will require fundamental structural changes, which should be designed to bring multiple co-benefits for humanity and planetary support systems.
▶ If the multiple co-benefits associated with closing the emissions gap are fully realized, the required transition will contribute in an essential way to achieving the United Nations 2030 Agenda with its 17 Sustainable Development Goals (SDGs).
▶ Climate protection and adaptation investments will become a precondition for peace and stability, and will require unprecedented efforts to transform societies, economies, infrastructures and governance institutions. At the same time, deep and rapid decarbonization processes imply fundamental structural changes are needed within economic sectors, firms, labour markets and trade patterns.
▶ By necessity, this will see profound change in how energy, food and other material-intensive services are demanded and provided by governments, businesses and markets. These systems of provision are entwined with the preferences, actions and demands of people as consumers, citizens and communities. Deep-rooted shifts in values, norms, consumer culture and world views are inescapably part of the great sustainability transformation.
▶ Legitimacy for decarbonization therefore requires massive social mobilization and investments in social cohesion to avoid exclusion and resistance to change. Just and timely transitions towards sustainability need to be developed, taking into account the interests and rights of people vulnerable to the impacts of climate change, of people and regions where decarbonization requires structural adjustments, and of future generations.
▶ Fortunately, deep transformation to close the emissions gap between trends based on current policies and achieving the Paris Agreement can be designed to bring multiple co-benefits for humanity and planetary support systems. These range, for example, from reducing air pollution, improving human health, establishing sustainable energy systems and industrial production processes, making consumption and services more efficient and sufficient, employing less-intensive agricultural practices and mitigating biodiversity loss to livable cities.
▶ This year’s report explores six entry points for progressing towards closing the emissions gap through transformational change in the following areas: (a) air pollution, air quality, health; (b) urbanization; (c) governance, education, employment; (d) digitalization; (e) energy- and material-efficient services for raising living standards; and (f) land use, food security, bioenergy. Building on this overview, a more detailed discussion of transitions in the energy sector is presented in chapter 6.
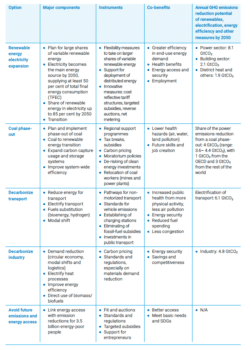
Table ES.3. Summary of five energy transition options.
8. Renewables and energy efficiency, in combination with electrification of end uses, are key to a successful energy transition and to driving down energy-related CO2 emissions.
▶ The necessary transition of the global energy sector will require significant investments compared with a business-as-usual scenario. Climate policies that are consistent with the 1.5°C goal will require upscaling energy system supply-side investments to between US$1.6 trillion and US$3.8 trillion per year globally on average over the 2020–2050 time frame, depending on how rapid energy efficiency and conservation efforts can be ramped up.
▶ Given the important role that energy and especially the electricity sector will have to play in any low-carbon transformation, chapter 6 examines five transition options, taking into account their relevance for a wide range of countries, clear co-benefit opportunities and potential to deliver significant emissions reductions. Each of the following transitions correspond to a particular policy rationale or motivation, which is discussed in more detail in the chapter:
- Expanding Renewable Energy for electrification.
- Phasing out coal for rapid decarbonization of the energy system.
- Decarbonizing transport with a focus on electric mobility.
- Decarbonizing energy-intensive industry.
- Avoiding future emissions while improving energy access.
▶ Implementing such major transitions in a number of areas will require increased interdependency between energy and other infrastructure sectors, where changes in one sector can impact another. Similarly, there will be a strong need to connect demand and supply-side policies and include wider synergies and co-benefits, such as job losses and creation, rehabilitation of ecosystem services, avoidance of resettlements and reduced health and environmental costs as a result of reduced emissions. The same applies for decarbonizing transport, where there will be a need for complementarity and coordination of policies, driven by technological, environmental and land-use pressures. Policies will need to be harmonized wherever possible to take advantage of interdependencies and prevent undesirable outcomes such as CO2 leakage from one sector to another.
▶ Any transition at this scale is likely to be extremely challenging and will meet a number of economic, political and technical barriers and challenges. However, many drivers of climate action have changed in the last years, with several options for ambitious climate action becoming less costly, more numerous and better understood. First, technological and economic developments present opportunities to decarbonize the economy, especially the energy sector, at a cost that is lower than ever. Second, the synergies between climate action and economic growth and development objectives, including options for addressing distributional impacts, are better understood. Finally, policy momentum across various levels of government, as well as a surge in climate action commitments by non-state actors, are creating opportunities for countries to engage in real transitions.
▶ A key example of technological and economic trends is the cost of renewable energy, which is declining more rapidly than was predicted just a few years ago (see figure ES.5). Renewables are currently the cheapest source of new power generation in most of the world, with the global weighted average purchase or auction price for new utility-scale solar power photovoltaic systems and utility-scale onshore wind turbines projected to compete with the marginal operating cost of existing coal plants by 2020. These trends are increasingly manifesting in a decline in new coal plant construction, including the cancellation of planned plants, as well as the early retirement of existing plants. Moreover, real-life cost declines are outpacing projections.
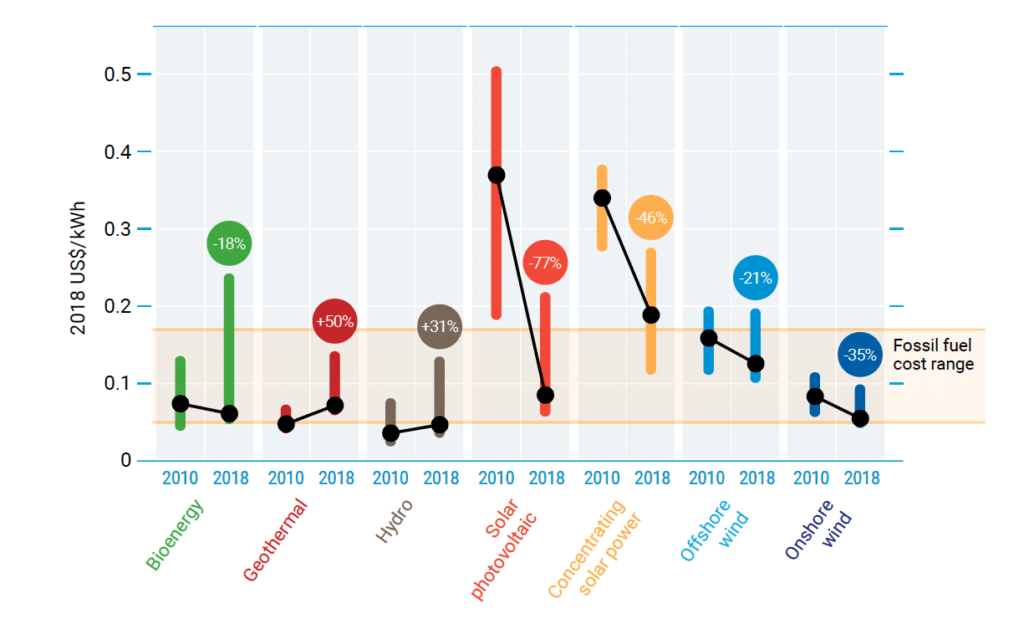
Figure ES.5. Changes in global levelized cost of energy for key renewable energy technologies, 2010-2018.
9. Demand-side material efficiency offers substantial GHG mitigation opportunities that are complementary to those obtained through an energy system transformation.
▶ While demand-side material efficiency widens the spectrum of emission mitigation strategies, it has largely been overlooked in climate policymaking until now and will be important for the cross-sectoral transitions.
▶ In 2015, the production of materials caused GHG emissions of approximately 11.5 GtCO2e, up from 5 GtCO2e in 1995. The largest contribution stems from bulk materials production, such as iron and steel, cement, lime and plaster, other minerals mostly used as construction products, as well as plastics and rubber. Two thirds of the materials are used to make capital goods, with buildings and vehicles among the most important. While the production of materials consumed in industrialized countries remained within the range of 2–3 GtCO2e, in the 1995–2015 period, those of developing and emerging economies have largely been behind the growth. In this context, it is important to keep in mind the discussion about the point of production and points of consumption (see figure ES.6).
▶ Material efficiency and substitution strategies affect not only energy demand and emissions during material production, but also potentially the operational energy use of the material products. Analysis of such strategies therefore requires a systems or life cycle perspective. Several investigations of material efficiency have focused on strategies that have little impact on operations, meaning that trade-offs and synergies have been ignored. Many energy efficiency strategies have implications for the materials used, such as increased insulation demand for buildings or a shift to more energy-intensive materials in the light-weighting of vehicles. While these additional, material-related emissions are well understood from technology studies, they are often not fully captured in the integrated assessment models that produce scenario results, such as those discussed in this report.
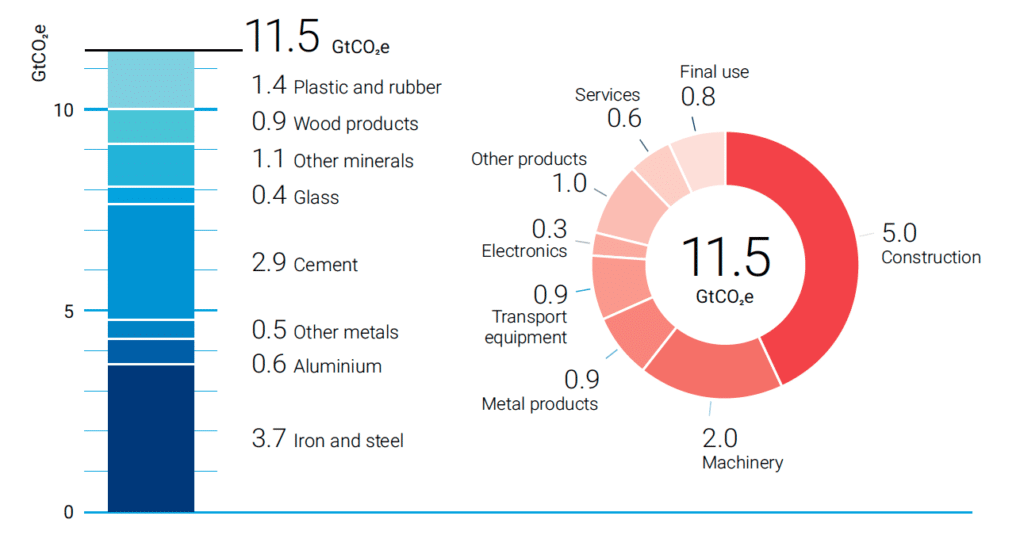
Figure ES.6. GHG emissions in GtCO2e associated with materials production by material (left) and by the first use of
materials in subsequent production processes or final consumption (right).
▶ In chapter 7, the mitigation potential from demand-side material efficiency improvements is discussed in the context of the following categories of action:
- Product light weighting and substitution of high carbon materials with low-carbon materials to reduce material-related GHG emissions associated with product production, as well as operational energy consumption of vehicles.
- Improvements in the yield of material production and product manufacture.
- More intensive use, longer life, component reuse, remanufacturing and repair as strategies to obtain more service from material-based products. Enhanced recycling so that secondary materials reduce the need to produce more emission-intensive primary materials.
▶ These categories are elaborated for housing and cars, showing that increased material efficiency can reduce annual emissions from the construction and operations of buildings and the manufacturing and use of passenger vehicles, thus contributing a couple of gigatons of carbon dioxide equivalent in emission reductions to the global mitigation effort by 2030.

