People tend to have a distorted picture of U.S. capitalism’s operation, believing that the great majority of Americans are doing well, benefiting from the system’s long-term growth and profit generation. Unfortunately, this is not true. Median wealth has been declining, leaving growing numbers of working people increasingly vulnerable to the ups and downs of economic activity and poorly positioned to enjoy a secure retirement. Moreover, this general trend masks a profound racial wealth divide, with people of color disproportionally suffering from a loss of wealth and insecurity.
A distorted picture of wealth inequality
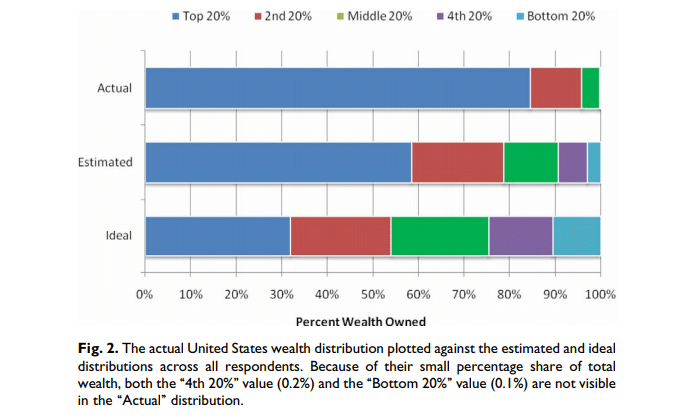
In a 2011 article, based on 2005 national survey data, Michael I. Norton and Dan Ariely demonstrate how little Americans know about the extent of wealth inequality. The figure below (labeled Fig. 2) shows the actual distribution of wealth in that year compared to what survey respondents thought it was, as well as their ideal wealth distribution. As the authors explain:
respondents vastly underestimated the actual level of wealth inequality in the United States, believing that the wealthiest quintile held about 59% of the wealth when the actual number is closer to 84%. More interesting, respondents constructed ideal wealth distributions that were far more equitable than even their erroneously low estimates of the actual distribution, reporting a desire for the top quintile to own just 32% of the wealth. These desires for more equal distributions of wealth took the form of moving money from the top quintile to the bottom three quintiles, while leaving the second quintile unchanged, evincing a greater concern for the less fortunate than the more fortunate.
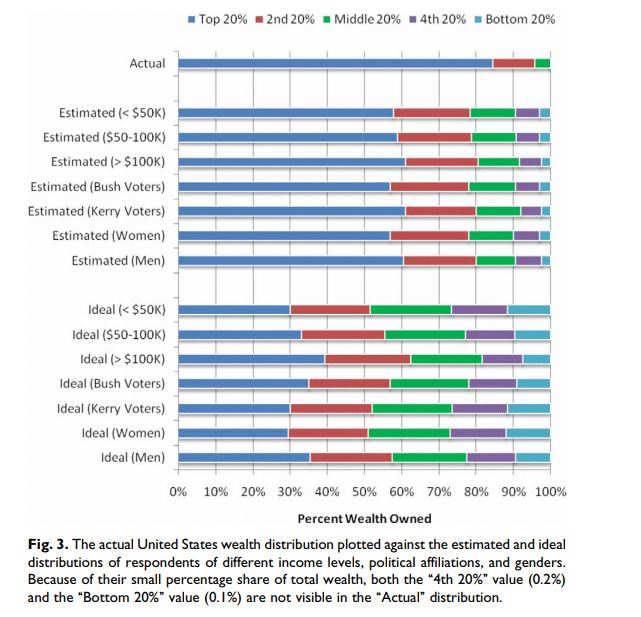
The next figure reveals that respondents tended to have remarkably similar perceptions of wealth distribution regardless of their income, political affiliation, or gender. Moreover, all the groups embraced remarkably similar ideal distributions that were far more egalitarian than their estimated ones.
Capitalist wealth dynamics
Wealth inequality has only grown worse since 2005. As I previously posted, in 2016, the top 10 percent of the population owned 77.1 percent of the nation’s wealth, while the bottom 10 percent owned -0.5 percent (they are net debtors). Even these numbers understate the degree of wealth concentration: the top 1 percent actually owned 38.5 percent of the wealth, more than the bottom 90 percent combined. This was a sharp rise from the 29.9 percent share they held in 1989.
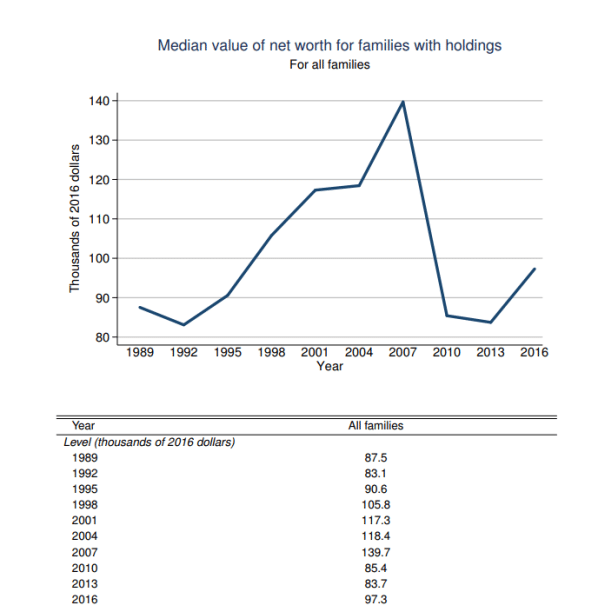
Perhaps more importantly, median household wealth is not only quite small–not nearly enough to provide financial stability and security–but is actually growing smaller over time. In fact, median household wealth in 2016 was 8 percent below what it had been in 1998.
The racial wealth divide
Of course, not all families receive equal treatment or are given similar opportunities for advancement. While U.S. capitalism works to transfer wealth upwards to the very rich, it has disproportionately exploited families of color. This is made clear by the results of a 2017 study titled The Road to Zero Wealth by Dedrick Asante-Muhammad, Chuck Collins, Josh Hoxie, and Emanuel Nieves.
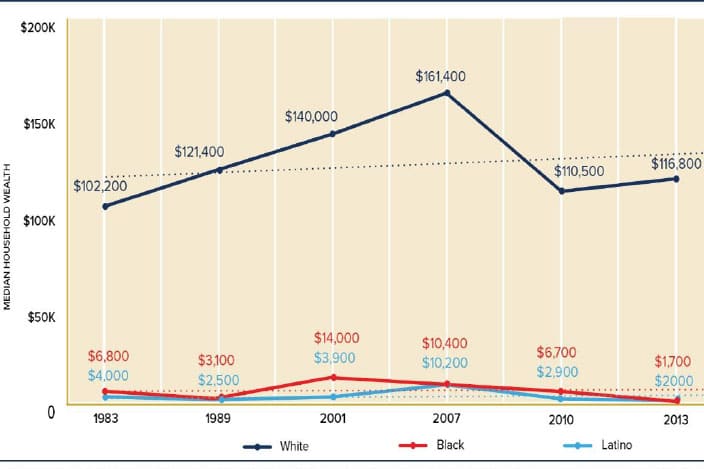
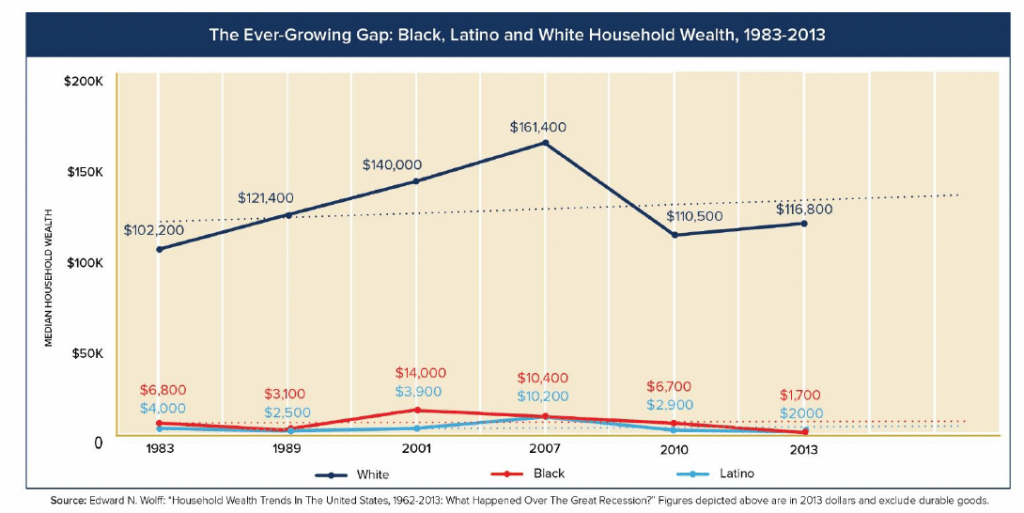
As we saw above, median household wealth has been on the decline since 2007, despite the growth in overall economic activity and corporate profits. The figure below shows median wealth trends for White, Black, and Latino households.
As of 2013, median White household wealth was less than it had been in 1989. However, the wealth decline has been far worse for Black and Latino families. More specifically, as the authors write:
Since 1983, the respective wealth of Black and Latino families has plunged from $6,800 and $4,000 in 1983 to $1,700 and $2,000 in 2013. These figures exclude durable goods like automobiles and electronics, as these items depreciate quickly in value and do not hold the same liquidity, stability or appreciation of other financial assets like a savings account, a treasury bond or a home.
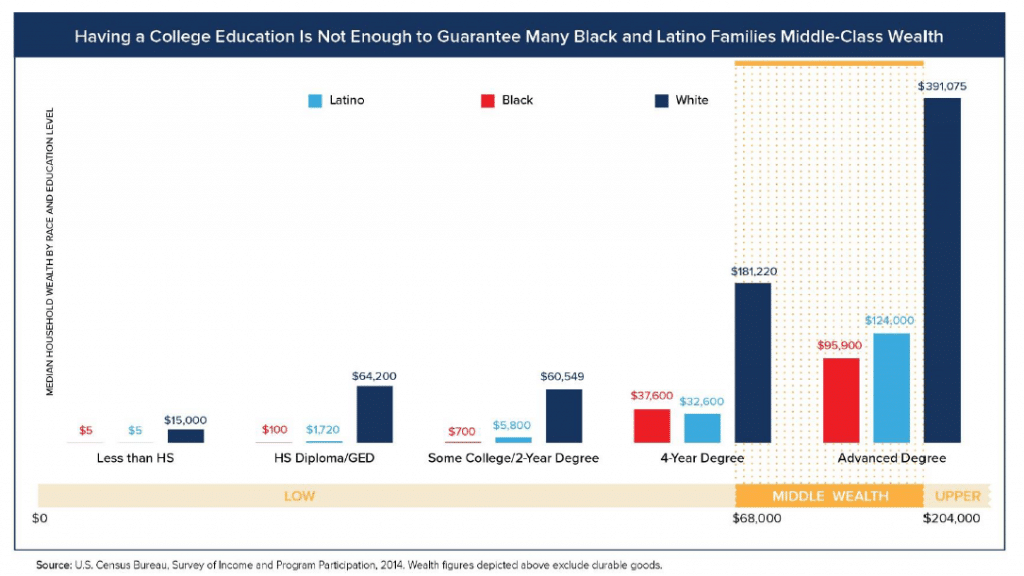
Education is supposed to be the great equalizer, with higher levels of education translating into more income, and then wealth. But as we see in the figure below, the combination of class policies on top of a history of discrimination and exclusion has left families of color at a significant disadvantage. For example, the median wealth of a family of color with a head of household with 4 year degree is far less than the median wealth of a White family with a head of household with only a high school diploma/GED.
The authors have created their own measure of “middle class wealth,” which they define:
using median White household wealth since it encompasses the full potential of the nation’s wealth-building policies, which have historically excluded households of color. More specifically, we use median White wealth in 1983 ($102,200 in 2013 dollars) as the basis for developing an index that would encompass “middle-class wealth” because it establishes a baseline prior to when increases in wealth were concentrated in a small number of households. Using this approach and applying Pew Research Center’s broad definition of the middle class, this study defines “middle class wealth” as ranging from $68,000 to $204,000.
As we can see in the figure above, only Black and Latino households with an advanced degree make it into that range. Moreover, trends suggest that, without major changes in policy, we can expect further declines in median wealth for households of color. In fact,
By 2020, if current trends continue as they have been, Black and Latino households at the median are on track to see their wealth decline by 17% and 12% from where they respectively stood in 2013. By then, median White households would see their wealth rise by an additional three percent over today’s levels. In other words, at a time when it’s projected that children of color will make up most of the children in the country, median White households are on track to own 86 and 68 times more wealth, respectively, than Black and Latino households. . . .
Looking beyond 2043, the situation for households of color looks even worse. . . .If unattended, trends at the median suggest Black household wealth will hit zero by 2053. In that same period, median White household wealth is expected to climb to $137,000. The situation isn’t much brighter for Latino households, whose median wealth is expected to reach zero by 2073, just two decades after Black wealth is projected to hit zero. . . . Wealth is an intergenerational asset—its benefits passed down from one generation to the next— and the consequences of these losses will reverberate deeply in the lives of the children and grandchildren of today’s people of color.
Of course, knowledge of the fact that capitalism’s growth largely benefits capitalists, and that people of color pay some of the greatest costs to sustain its forward motion, does not automatically lead to class solidarity and popular opposition to existing accumulation dynamics. Still, such knowledge does, at a minimum, help people understand that the forces pressing down on them are not the result of individual failure or lack of effort, but rather have systemic roots. And that is an important step in the right direction.

