It happened gradually, but thanks to the U.S. media, economic news has largely been reduced to stock market reporting. Want to know how the economy is doing? Check the S&P 500 Index. Want to know whether the latest Trump proposal is good or bad? Check the S&P 500 Index.
And perhaps even more amazingly, the media has also transformed the stock market into a new superhero. In good times it roars or soars. In bad time it weathers the storm, regroups, and battles back to defend our collective well-being.
Somehow real economic processes and even more importantly the actual economic well-being of people has largely been shoved to the background. Largely lost from view is the fact that most workers have suffered lost decades of earnings.
The Stock Market
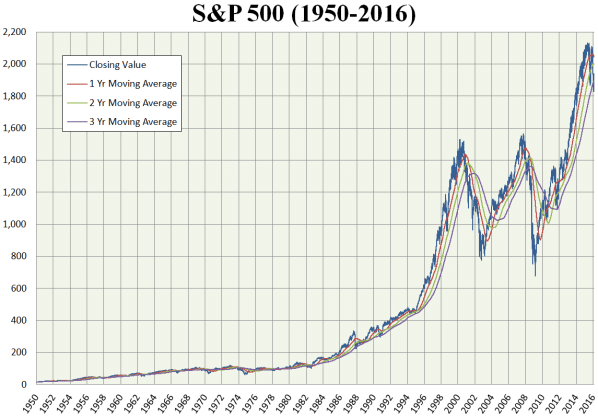
As we see below the stock market, represented by the S&P 500, has enjoyed quite a run over the last few decades.
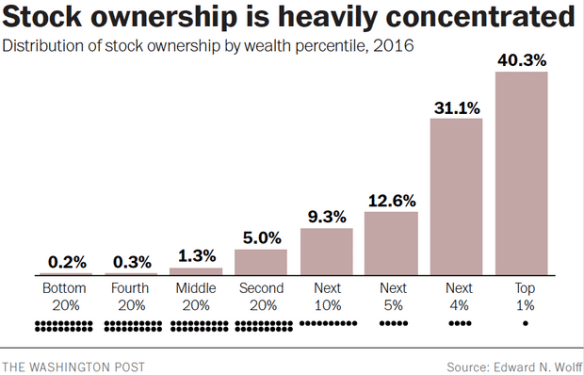
Left out of the celebration is the fact that few Americans own stock; in fact more than half of all U.S. households own no stock at all, even indirectly through pension plans or mutual funds.
According to NYU economist Edward N. Wolff, as shown below, the wealthiest 10 percent of U.S. households owned 84 percent of all stocks, by value, in 2016. That is up from 77 percent in 2001. By contrast, the bottom 60 percent of households owned just 1.8 percent of total stock value.
As the Washington Post explains:
For the top 20 percent of households, the day-to-day movements of the Dow Jones reflect real changes in their net worth and financial health. Big shifts in the market might mean the difference between retiring today and retiring five years from now, or between buying that bungalow right on the beach and buying the one a few blocks away.
But for many of the remaining 80 percent of American families, who collectively own less than 7 percent of the stock market even when you factor in their retirement accounts, the Dow and the S&P 500 are little more than numeric abstractions.
Lost Decades
The stock market’s rise and our growing identification with it tends to hide what is really happening to people. Here, at a ground level, the sad reality is that most workers have experienced lost decades of earnings.
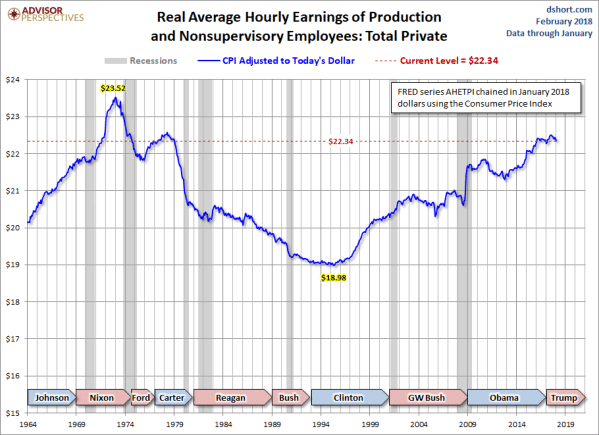
The chart below, taken from an analysis by Jill Mislinski for Advisor Perspectives, shows the real average hourly earnings of production and nonsupervisory employees in the private sector, a category that includes close to 85 percent of all private sector employees. As we can see, real average hourly earnings in January 2018 are about what they were in 1978, four decades earlier, and considerably below their 1973 peak, and that is after a sustained rise. A lot of income was lost over that period.
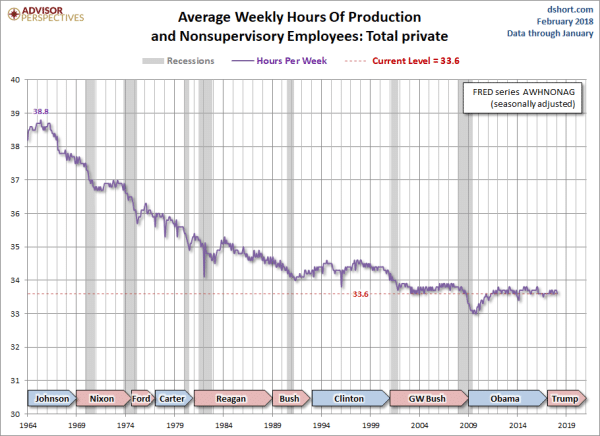
The loss of income is even greater when we take into account the gradual, long term decline in average weekly hours, illustrated next.
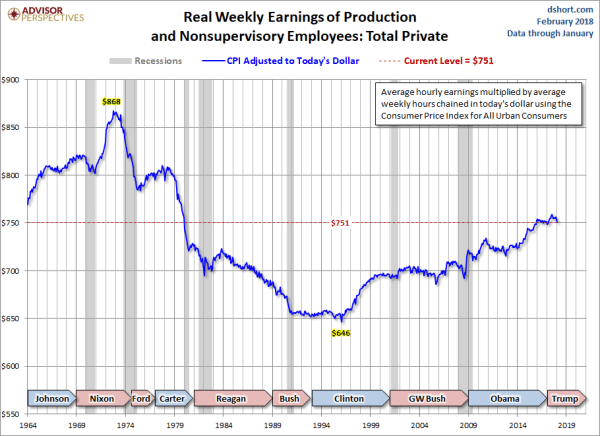
Putting the two series together gives us the trend in average real weekly earnings. As we can see, despite decades of growth in the economy and stock market, real average weekly earnings of production and nonsupervisory employees have a long way to go to compensate for decades of decline and stagnation.
Jill Mislinksi offers the following perspective on this trend in average weekly earnings:
If we multiply the hypothetical weekly earnings by 50, we get an annual figure of $37,531. That’s a 13.5% decline from the similarly calculated real peak in October 1972. In the charts above, we’ve highlighted the presidencies during this time frame. Our purpose is not necessarily to suggest political responsibility, but rather to offer some food for thought. We will point out that the so-called supply-side economics popularized during the Reagan administration (aka “trickle-down” economics), wasn’t very friendly to production and nonsupervisory employees.
One small way we can help speed needed change is to challenge the media embrace of the stock market as our representative economic indicator and demand that economic reporting focus on meaningful realities for the great majority.


