The Case-Shiller 20-City index rose by 0.8 percent in April, the first increase since last September. Prices rose in 18 of the 20 cities, with only New York and Miami reporting price declines. The biggest increases were in Washington, DC, where prices rose by 2.4 percent, San Francisco, with a 2.2 percent increase, and Dallas, with a 2.0 percent increase. Prices also rose by 1.8 percent in May in Atlanta, Minneapolis, and Portland.
The expiration of the first-time buyers tax credit was clearly a main factor in this price rise. The April figure is based on closing in March, April, and May, all of which would likely have been affected by the need to get a contract signed by the end of April in order to qualify for the credit.
The influence of the tax credit is demonstrated by the fact that in most cities, homes in the bottom third of the market saw the greatest price rise. For example, in Las Vegas, prices for homes in the bottom tier rose by 2.3 percent in May, while they fell for homes in the other two tiers. Over the last quarter, the price of homes in the bottom third of the market have risen at a 14.7 percent annual rate, while they have fallen at a 2.8 percent rate for the middle tier and a 5.8 percent rate for the top tier. There is a similar story for Los Angeles, where prices for homes in the bottom tier rose 1.6 percent in May, while prices for the middle tier rise by 0.7 percent, and prices for homes in the top tier fell by 0.4 percent.
The tax credit will have the most impact on the bottom tier both because it is primarily oriented toward first-time buyers, who will mostly buy lower end homes, and also because the $8,000 credit is a larger share of the price of cheaper homes. Therefore it can be expected to have a greater influence on their price.
With the credit ending for homes contracted after April 30th, this is likely the last month for which it will be boosting prices. The sales that were contracted in time to qualify for the credit will mostly close by the end of May and therefore be included in the April Case-Shiller data. The May data will include home closings in June, many of which will have been contracted after the expiration of the deadline.
At this point, it seems clear that demand fell off sharply as soon as the deadline passed, repeating the pattern seen after the expiration of the original credit in November. New home sales for May, which reflect contracts signed in the month, were down 32.7 percent from the April level, hitting the lowest level on record. This followed a 14.7 percent increase in new home sales for April. It is also worth noting that the median price of new homes fell sharply the last two months. It dropped 9.6 percent in April, which is a predictable result of a surge in first-time buyers contracting for new homes. However, the median price fell another 1.0 percent in May, which indicates that serious weakness in the market is forcing builders to sell at deep discounts.
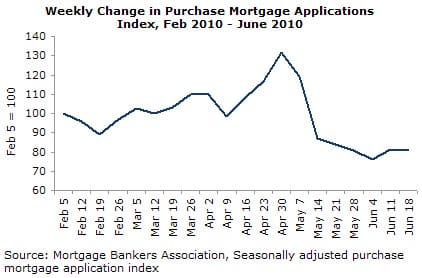
The mortgage applications index showed a similar pattern with mortgage applications remaining strong through April. The index then plunged in May, hitting its lowest levels since 1997.
As would be expected, the tax credit pulled many purchases forward. This means that the rate of sales in the period just before the expiration of the credit was higher than the underlying trend and the rate of sales in the months following the expiration will be considerably lower than the underlying trend. Since prices were actually falling through most of the period prior to the expiration of credit, it seems certain that the rate of house price decline will accelerate sharply in the second half of 2010. If the situation in Europe stabilizes so that the flight to the dollar is reversed, then it will lead to higher mortgage interest rates, which will be another factor dampening demand.
Dean Baker is the co-director of the Center for Economic and Policy Research (CEPR). He is the author of False Profits: Recovering from the Bubble Economy. He also has a blog Beat the Press, where he discusses the media’s coverage of economic issues. This article was published by CEPR on 29 June 2010 under a Creative Commons license.
| Print

