Introduction
Recently governments, economists, and international financial institutions have been debating the merits of further fiscal stimulus to combat the Great Recession versus fiscal austerity or “adjustment” — that is, higher taxes and/or lower government spending — to combat budget deficits. Some supporters of austerity have gone as far as arguing that fiscal adjustment could restore economic growth. These analyses are being touted to oppose increased stimulus to boost the economy. This paper examines the arguments for austerity and demonstrates that current economic conditions in the United States do not support the case for fiscal adjustment.
The Effects of the Great Recession
The Great Recession has led to the longest sustained period of high unemployment in the post-war era. The unemployment rate in the United States was 9.6 percent in August, 4.6 percentage points above the Congressional Budget Office’s (CBO) estimate of the rate we would have if the economy were now operating at its full capacity and 5.1 percentage points above the low point hit in 2007 before the recession.1 This large unemployment gap would seem to argue for aggressive fiscal and monetary stimulus.
CBO also calculates that the gap between potential GDP and actual GDP will be $730 billion in 2010. This is equal to almost $2,400 in wasted output per person. By 2014, when CBO projects that the economy will again be close to normal levels of unemployment, the economy is projected to have lost a total of $3.4 trillion in output due to the downturn, more than $11,000 per person, as shown in Figures 1a and 1b. Losses of this magnitude swamp the damage done by even the worst policy mistakes of the last half-century. The losses from the recession also vastly exceed the cost of any of the government programs that have proven controversial in recent years, as shown in Figure 2.
FIGURE 1A: CBO Projection of Lost Economic Output Due to Downturn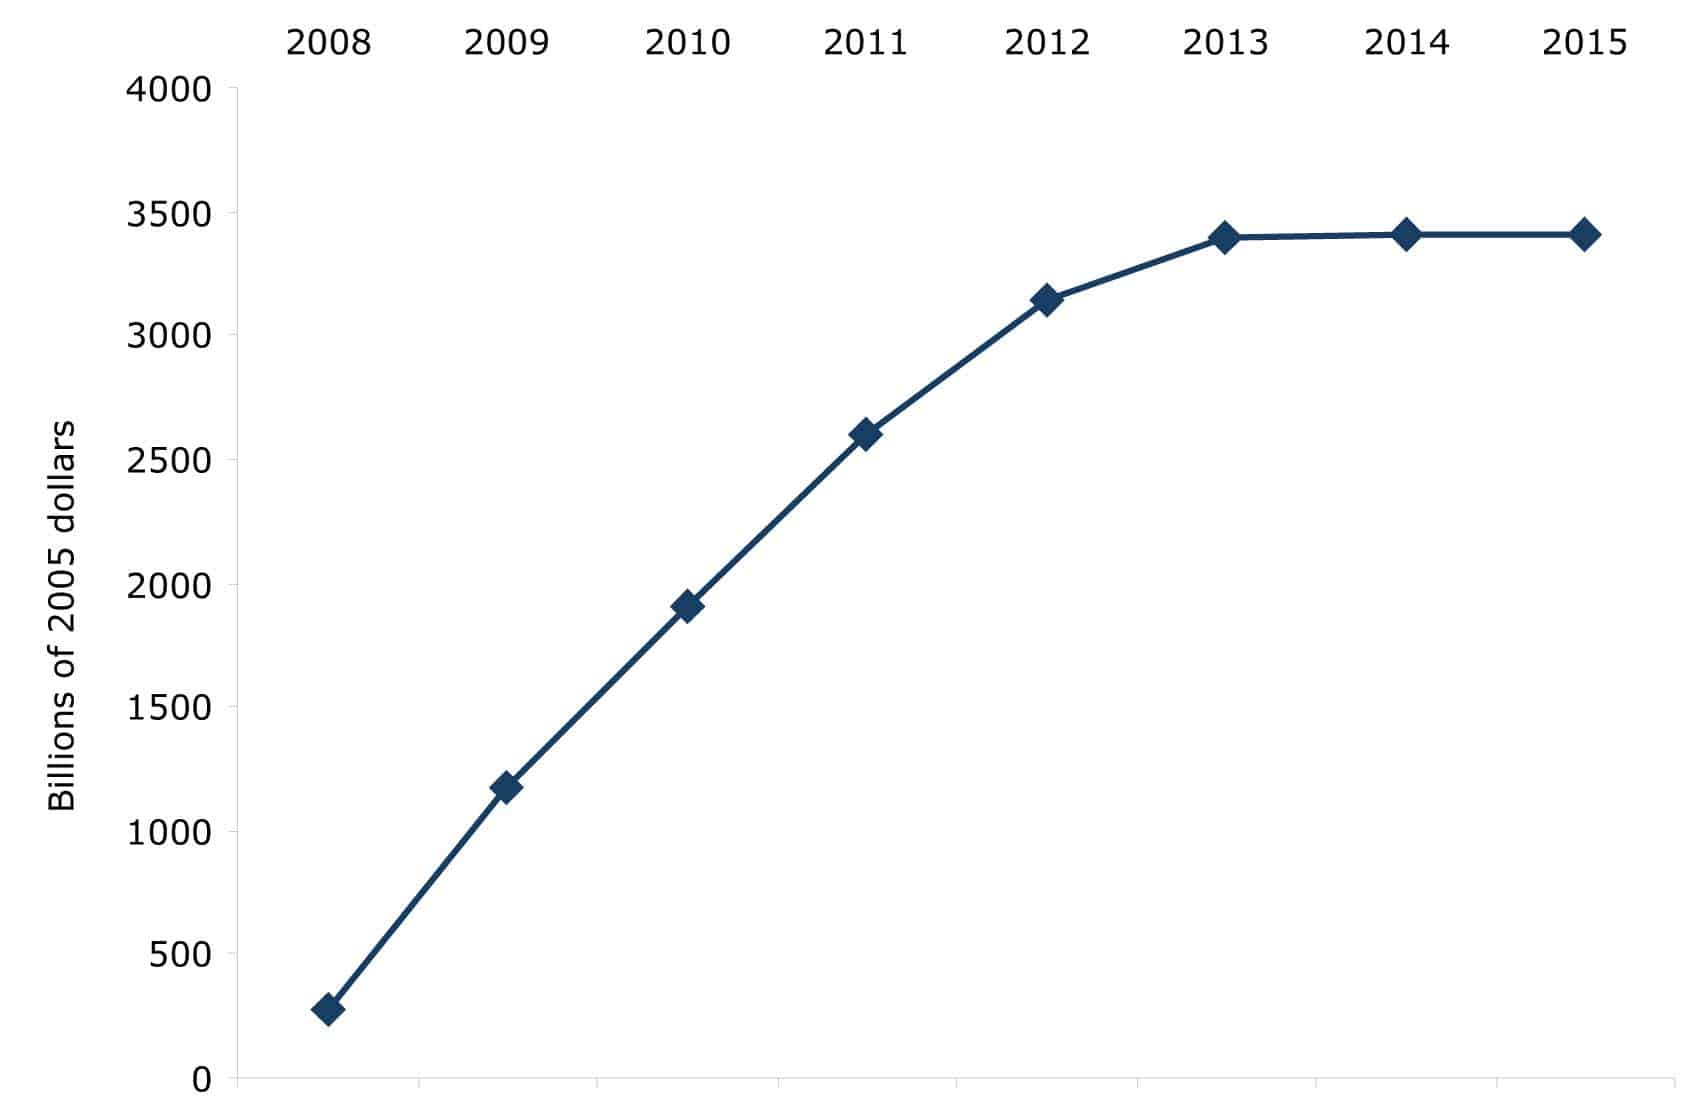
Source: CBO
FIGURE 1B: CBO Projection of Lost Economic Output Per Person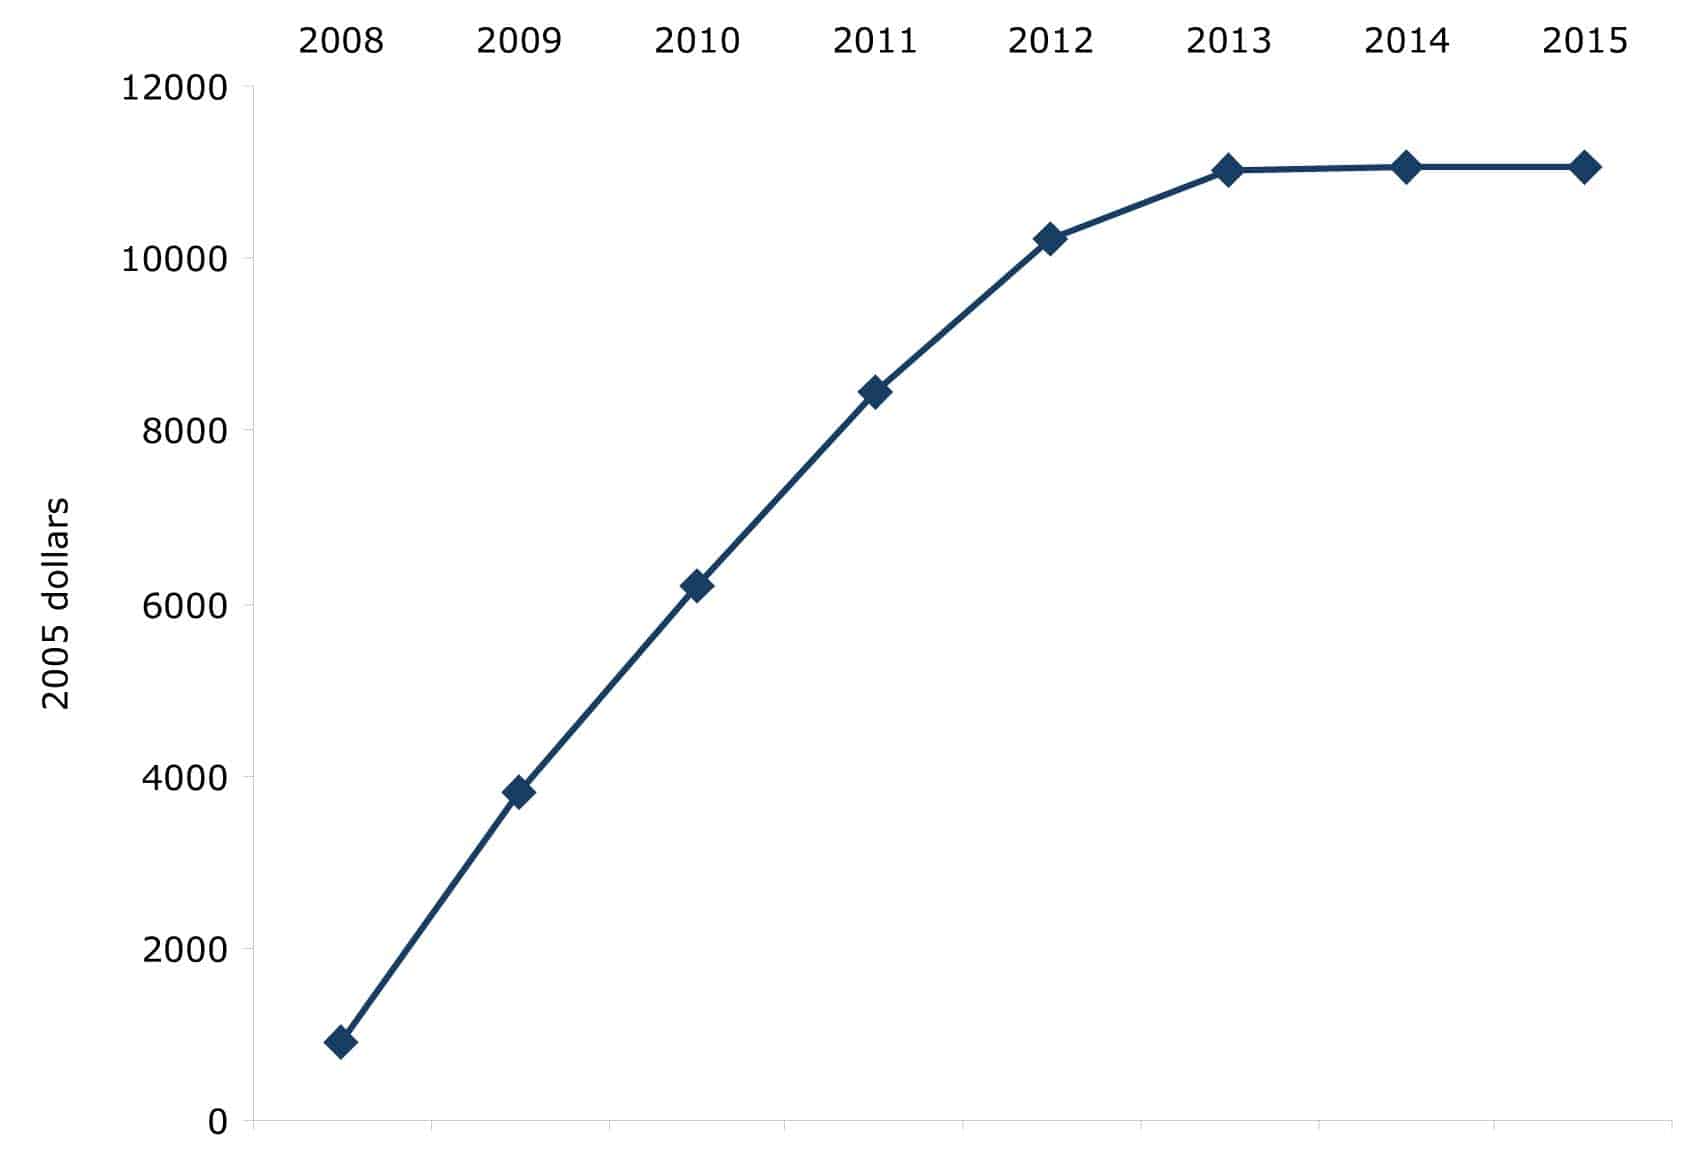
Source: Author’s analysis of CBO
FIGURE 2: Per-person Costs of GDP Loss, Unemployment Benefits, and Temporary Assistance to Needy Families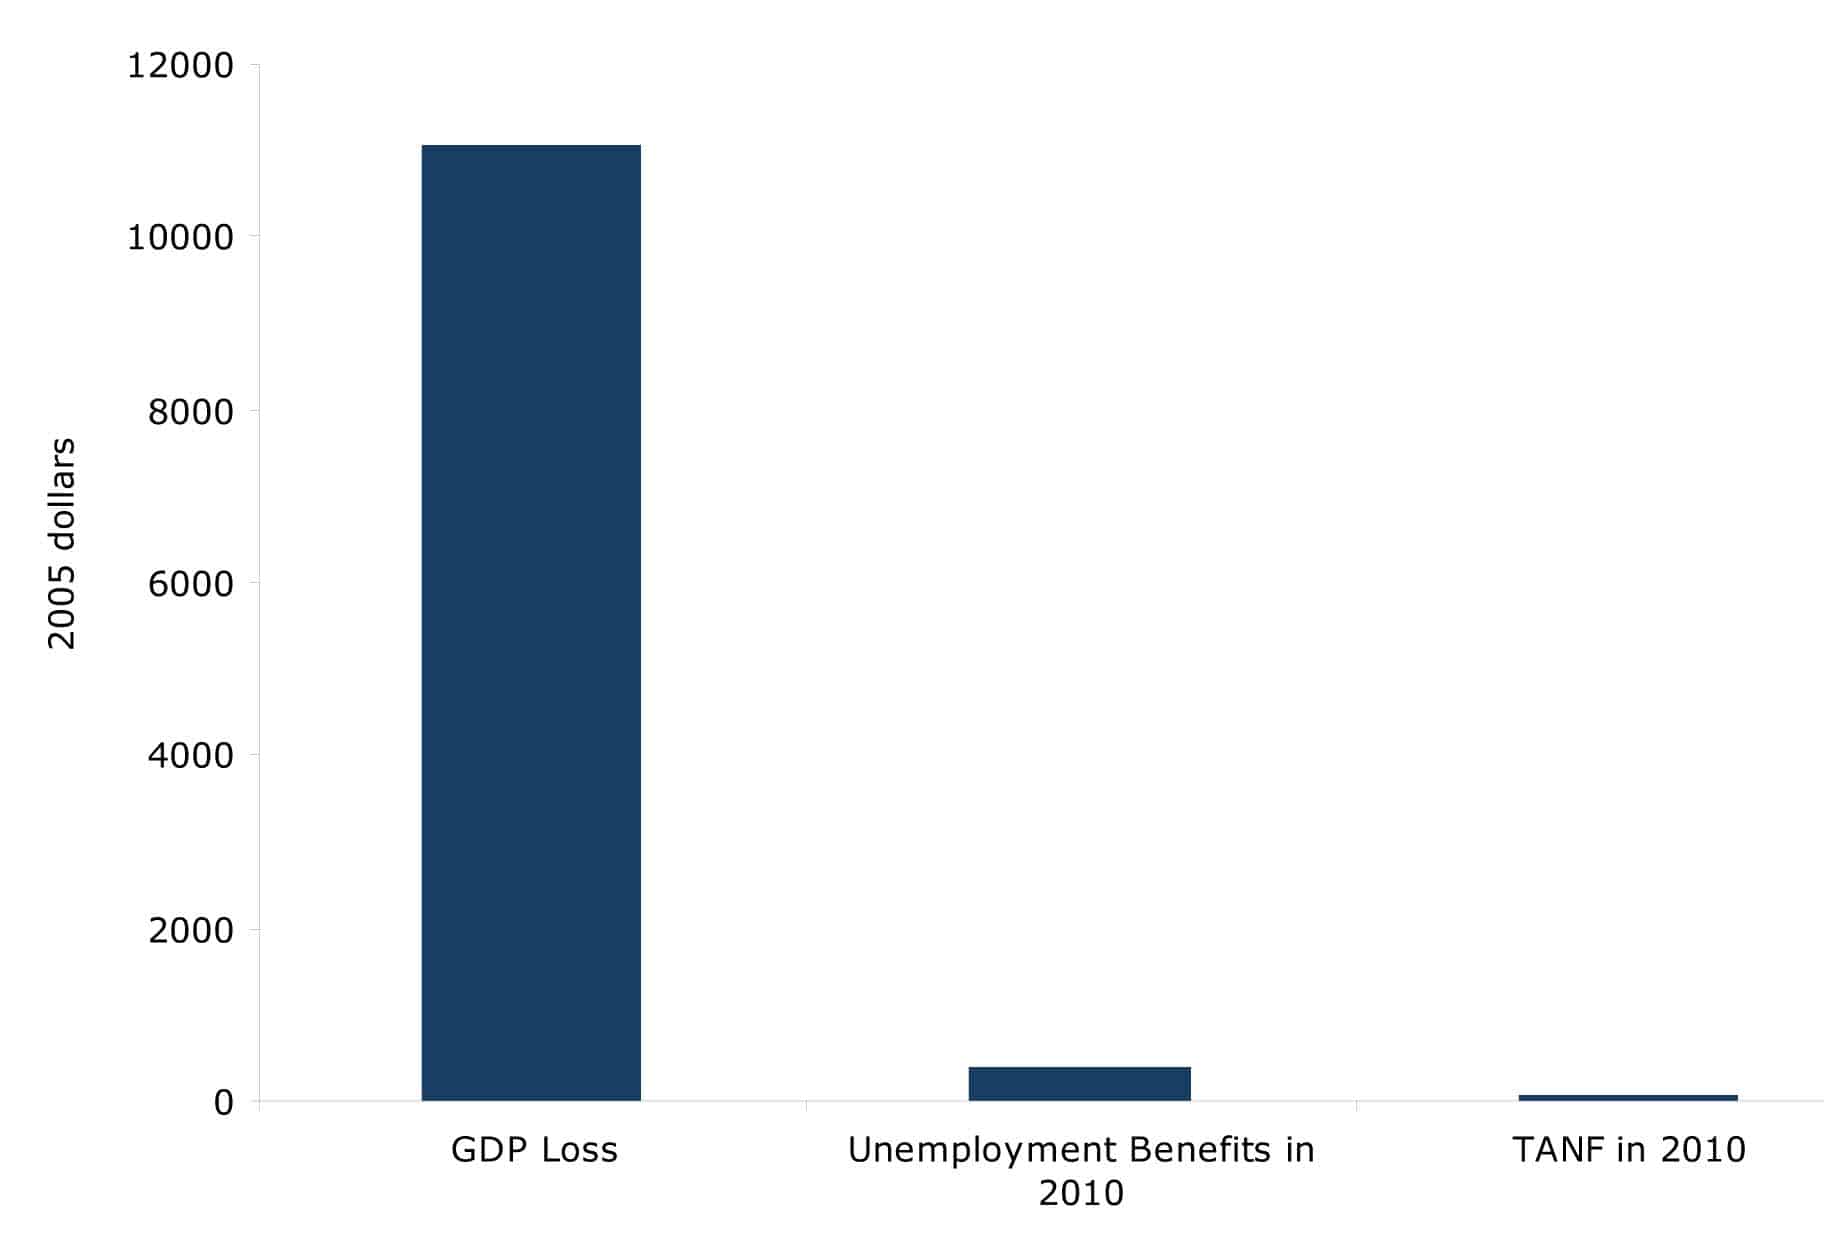
Source: Author’s analysis of CBO.
It is worth noting that even these projections may prove overly optimistic. CBO projected that the unemployment rate would average 9.5 percent for 2010. Thus far it has averaged 9.7 percent. With the economy creating few, if any, jobs, the unemployment rate is likely to rise by the end of the year. This means that the gaps in output for both 2010 and 2011 are likely to be considerably higher than CBO had projected.
The situation is made even worse by the fact that these losses are not evenly shared. High rates of unemployment create anxiety among tens of millions of employed but vulnerable workers. They also put downward pressure on the wages of workers who most fear unemployment, which are disproportionately workers without college degrees. However, the unemployed and under-employed bear the bulk of the loss that results from the economy operating far below its potential level of output. These workers have, by far, seen the sharpest decline in income and are in the most precarious financial situation. They have suffered the greatest losses from the Great Recession.
By contrast, corporate profits have completely recovered from the downturn. In the 2nd quarter of 2010, the broadest measure of corporate profits, net operating surplus, stood at $1,570 billion. This is $104 billion, or more than 7.0 percent, above the pre-recession peak reached in the 2nd quarter of 2007, as shown in Figure 3. The recovery of profits suggests that corporations, or more specifically their major shareholders and top executives, are no longer feeling the pain of the downturn. They have managed to adjust to an environment of lower output by increasing their profit margins. Even though their revenues may still be below pre-recession levels, by increasing the profit share of corporate income they have been able to shield themselves from the effects of continuing economic weakness.
FIGURE 3: Domestic Corporate Profits (broad measure) 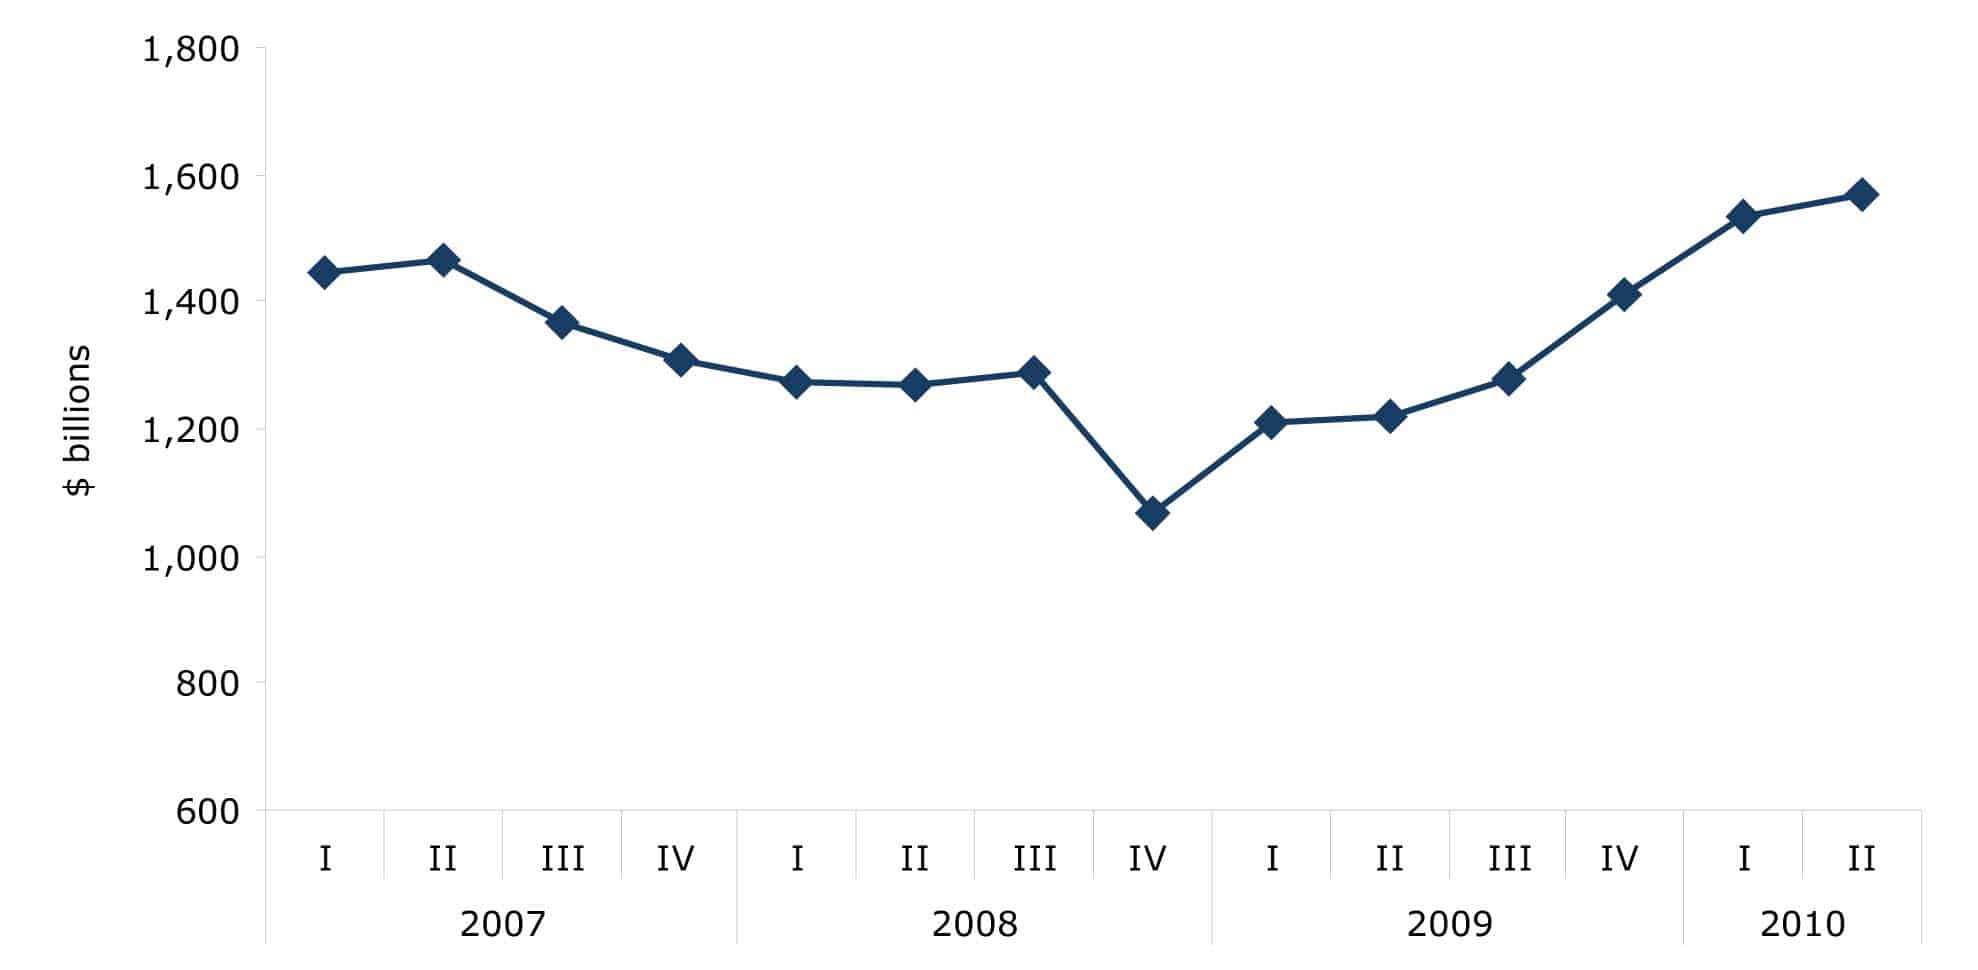
Source: Bureau of Economic Analysis, National Income and Product Accounts, Table 1.14, Line 8
This background is worth noting in assessing the case for stimulus. While restoring the economy to its potential level of output will offer large gains to those who are unemployed or at substantial risk of unemployment, those who derive their income from owning capital or running large corporations will have less obvious benefits from a return to full employment.
The Logic of an Expansionary Fiscal Adjustment
Proponents of fiscal stimulus see the direct effects of the stimulus as fostering growth. Government spending, for example on infrastructure or education, directly employs people and also provides paychecks that will mostly be spent by the workers hired, creating additional demand and employment. Transfer payments like unemployment benefits or tax cuts also put money into people’s pockets, much of which will typically be spent, thereby creating demand and jobs.
By contrast, advocates of fiscal adjustment, in the form of higher taxes and/or lower government spending, rely on the indirect effect of these policies to increase growth. The argument is that fiscal adjustment will reduce the government’s demand on the economy’s resources, thereby allowing the private sector to make better use of these resources. In principle, this shift to private sector spending comes about through lower interest rates, which both fosters domestic investment and leads to a lower-valued currency that supports improvements in the trade balance.
The decline in the value of the currency makes the adjusting country’s goods more competitive internationally. With a lower-valued currency, imports are more expensive relative to domestically produced goods, which should lead to a substitution of domestically produced items for imports. At the same time, a lower-valued currency makes the adjusting country’s exports cheaper for its trading partners. This should lead them to purchase more of the country’s exports. Reducing imports and increasing exports can be an important channel for growth, especially for a country that is heavily involved in international trade.
Lower interest rates should also boost domestic investment and consumption. Lower interest rates make it relatively cheaper for firms to borrow money to finance investment in plants and equipment, research and development, or marketing new lines of products. Lower interest rates tend to promote consumption both by making saving relatively less attractive, and also by freeing up money for consumption by allowing consumers to refinance debt at lower interest rates.
This is most notable with mortgages, which can typically be refinanced when interest rates fall. This frees up money from debt payments for other forms of consumption. (While the drop in interest rates reduces the money received by investors, they typically will spend a smaller share of their income than homeowners, so the redistribution from creditors to debtors generally leads to more consumption.)
These routes to increased demand, through lower interest rates, provide clear mechanisms through which a fiscal adjustment can be expansionary. If the increase in demand from an improved trade position, combined with increased investment and consumption, exceeds the falloff in demand that results from a combination of tax increases and spending cuts, then the fiscal adjustment can be expansionary. Whether in practice it is expansionary depends on the relative size of these effects. Of course, lower interest rates are a key part of the story. If interest rates do not fall as a result of the adjustment, then there is no reason to expect any boost through either the investment or the trade channels.
The Goldman Sachs Case for Expansionary Adjustments
There has been a recent series of papers arguing for the growth benefits from fiscal adjustments. The most prominent proponent of this position, Harvard University economist Alberto Alesina, has written papers over the last two decades purportedly showing that fiscal adjustments can be expansionary even in the short run.2 This work has been widely cited by those who have argued for fiscal austerity even in the context of the sharp downturn that the world economy is now experiencing.
The International Monetary Fund (IMF) recently examined the argument advanced by Alesina and found that adjustments are, in contrast, contractionary in the short run.3 The fiscal adjustments identified by the IMF differed somewhat from the ones identified by Alesina, in part because the IMF focused on changes in deficits that were directly driven by policy. While Alesina did use cyclically adjusted measures of budget deficits, a cyclical adjustment will not always accurately distinguish between changes that were endogenous and changes that were policy-driven.4
When the IMF focused exclusively on policy-driven fiscal adjustments it got results that were consistent with standard Keynesian analysis. In the short run, fiscal adjustment is contractionary, with cuts in spending being more contractionary than increases in taxes. This is consistent with both the theoretical view that spending will more directly impact the economy than taxes and also a large amount of research that has found higher multipliers for changes in spending than changes in taxes.5
In the same vein as the Alesina work, Goldman Sachs recently produced an analysis that purports to show that fiscal adjustment can be expansionary in the short run and that adjustments that focus on cuts in spending are most likely to promote growth.6 This paper is worth examining because it provides some insight into the logic of this argument and why it is completely inappropriate for the United States in its current economic situation.
This paper, by Broadbent and Daly, identifies 44 instances of large fiscal adjustments over the last 35 years in OECD countries. Of these 44 adjustments, it identifies 11 cases of fiscal adjustment that were accomplished primarily through cuts in spending. The study argues that these expansions were considerably more robust than the expansions following tax adjustments. The paper argues that the expenditure-driven fiscal adjustments led to sharply lower bond yields and strong surges in equity prices. The authors suggest this led to strong growth in investment, which helped fuel growth rates well in excess of the OECD average in the 3-5 years following the adjustment.
While the Broadbent and Daly study may provide useful insights on the potential for fiscal adjustments to boost growth, its relevance to the current situation in the United States is questionable. The vast majority of instances of fiscal adjustment took place during periods when economies were near or above potential GDP. In only 6 of the 29 fiscal adjustments that were tax-driven was the gap between potential and actual GDP even as large as one percentage point. In only two instances, Netherlands (1983) and Norway (2004-06), were the gaps more than two percentage points of GDP, as shown in Figure 4. By comparison, the output gap in the United States is more than five percentage points of GDP in 2010, according to the Congressional Budget Office.
FIGURE 4: Output Gaps at Start of Fiscal Adjustments —
Tax Adjustments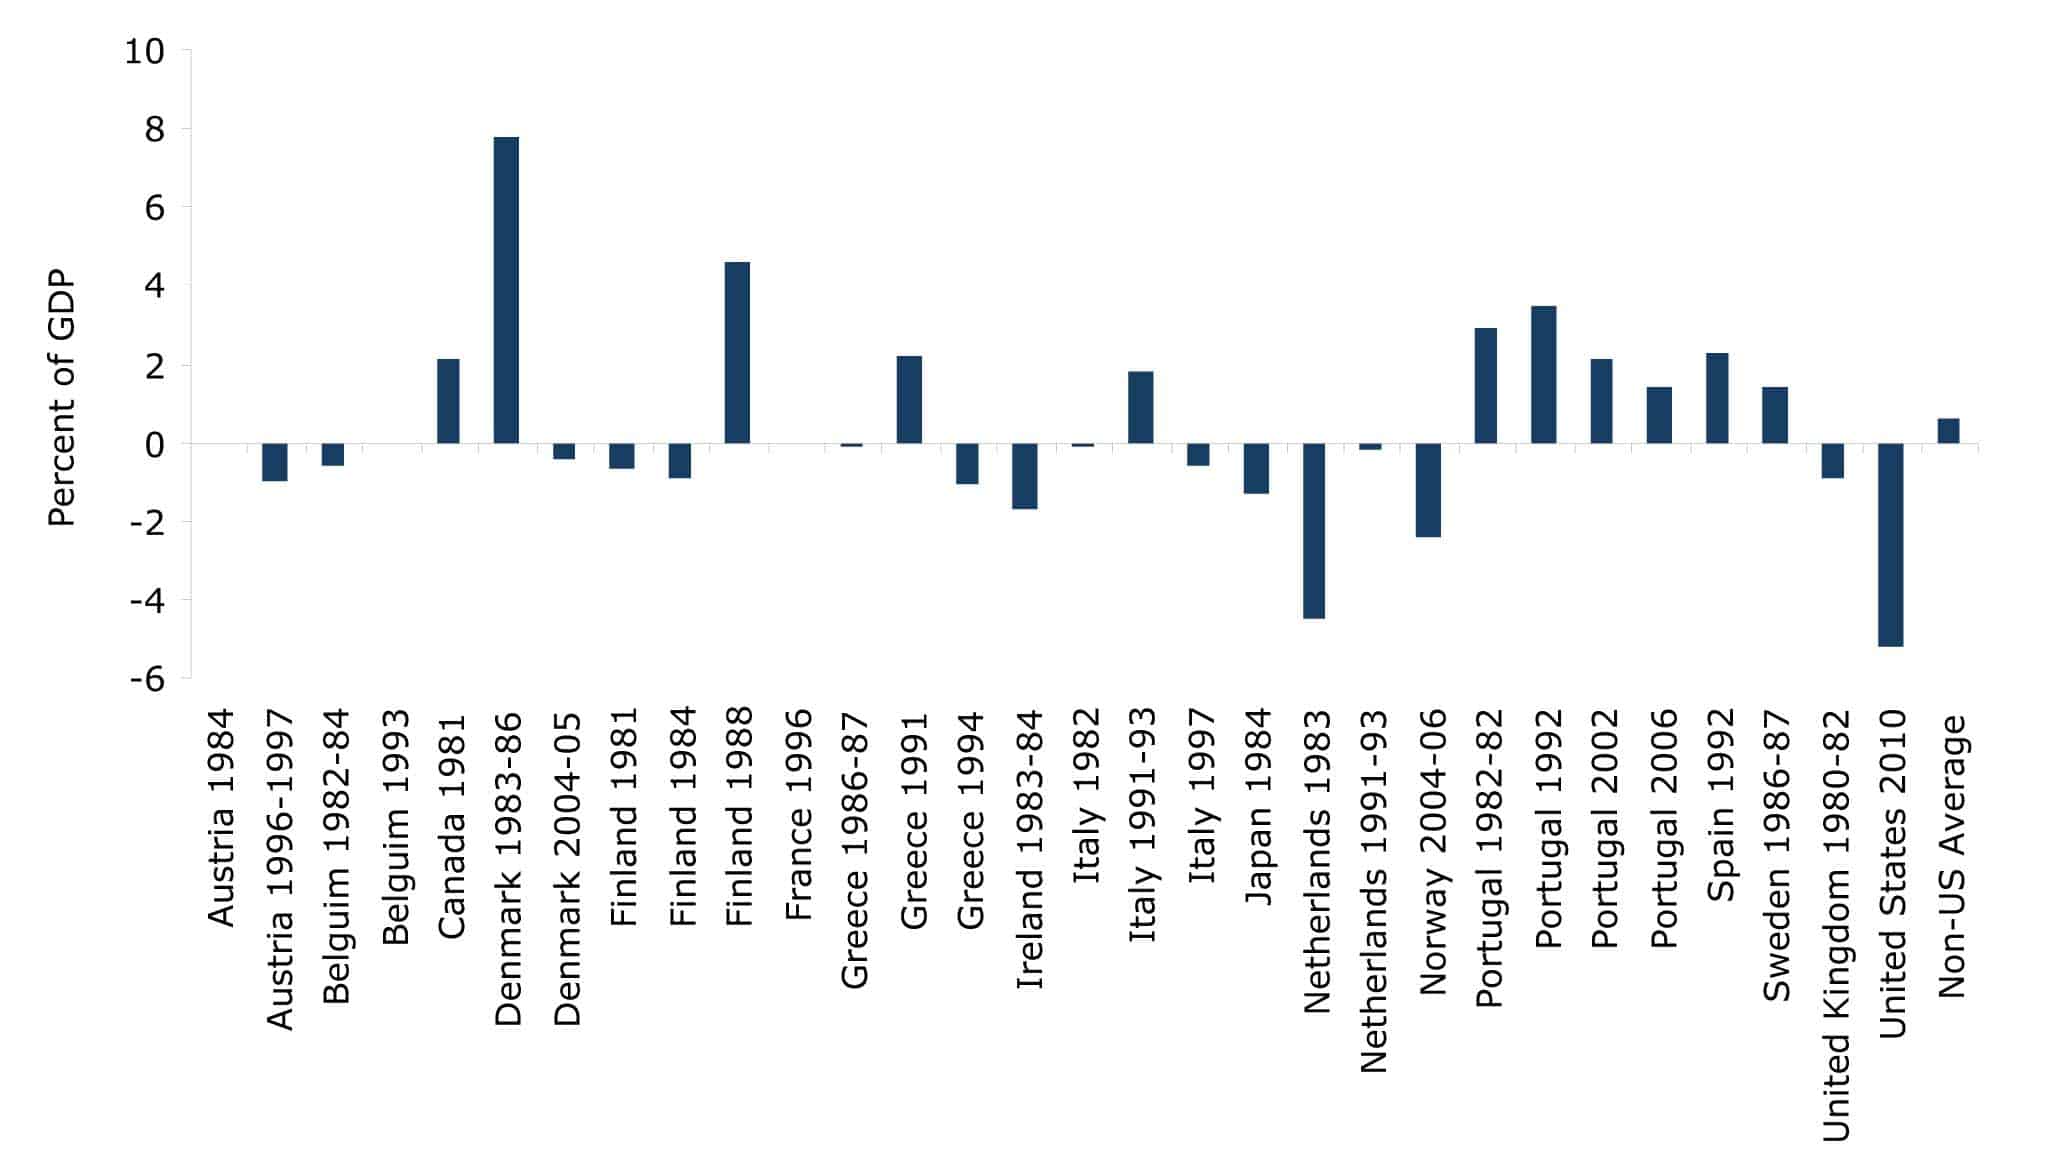
Source: CBO and International Monetary Fund, World Economic Outlook database, available at www.imf.org/external/pubs/ft/weo/2010/01/weodata/index.aspx
The story is a bit different with the expenditure-driven adjustments. In five of the ten adjustments for which there is data, the output gap was more than one percentage point of GDP at the beginning of the adjustment. In four of these five cases the gap was more than two percentage points of GDP, as shown in Figure 5. These four cases were Finland (1996-2000), Netherlands (1996), Norway (1994-95), and Sweden (1994-98). However, in none of these cases was an economy as far below its potential as the United States economy in 2010. The biggest output gap among this group was the 3.7 percentage point gap in Sweden at the start of its adjustment. That is still 1.5 percentage points smaller than the gap in the United States.
FIGURE 5: Output Gaps at Start of Fiscal Adjustments —
Expenditure Adjustments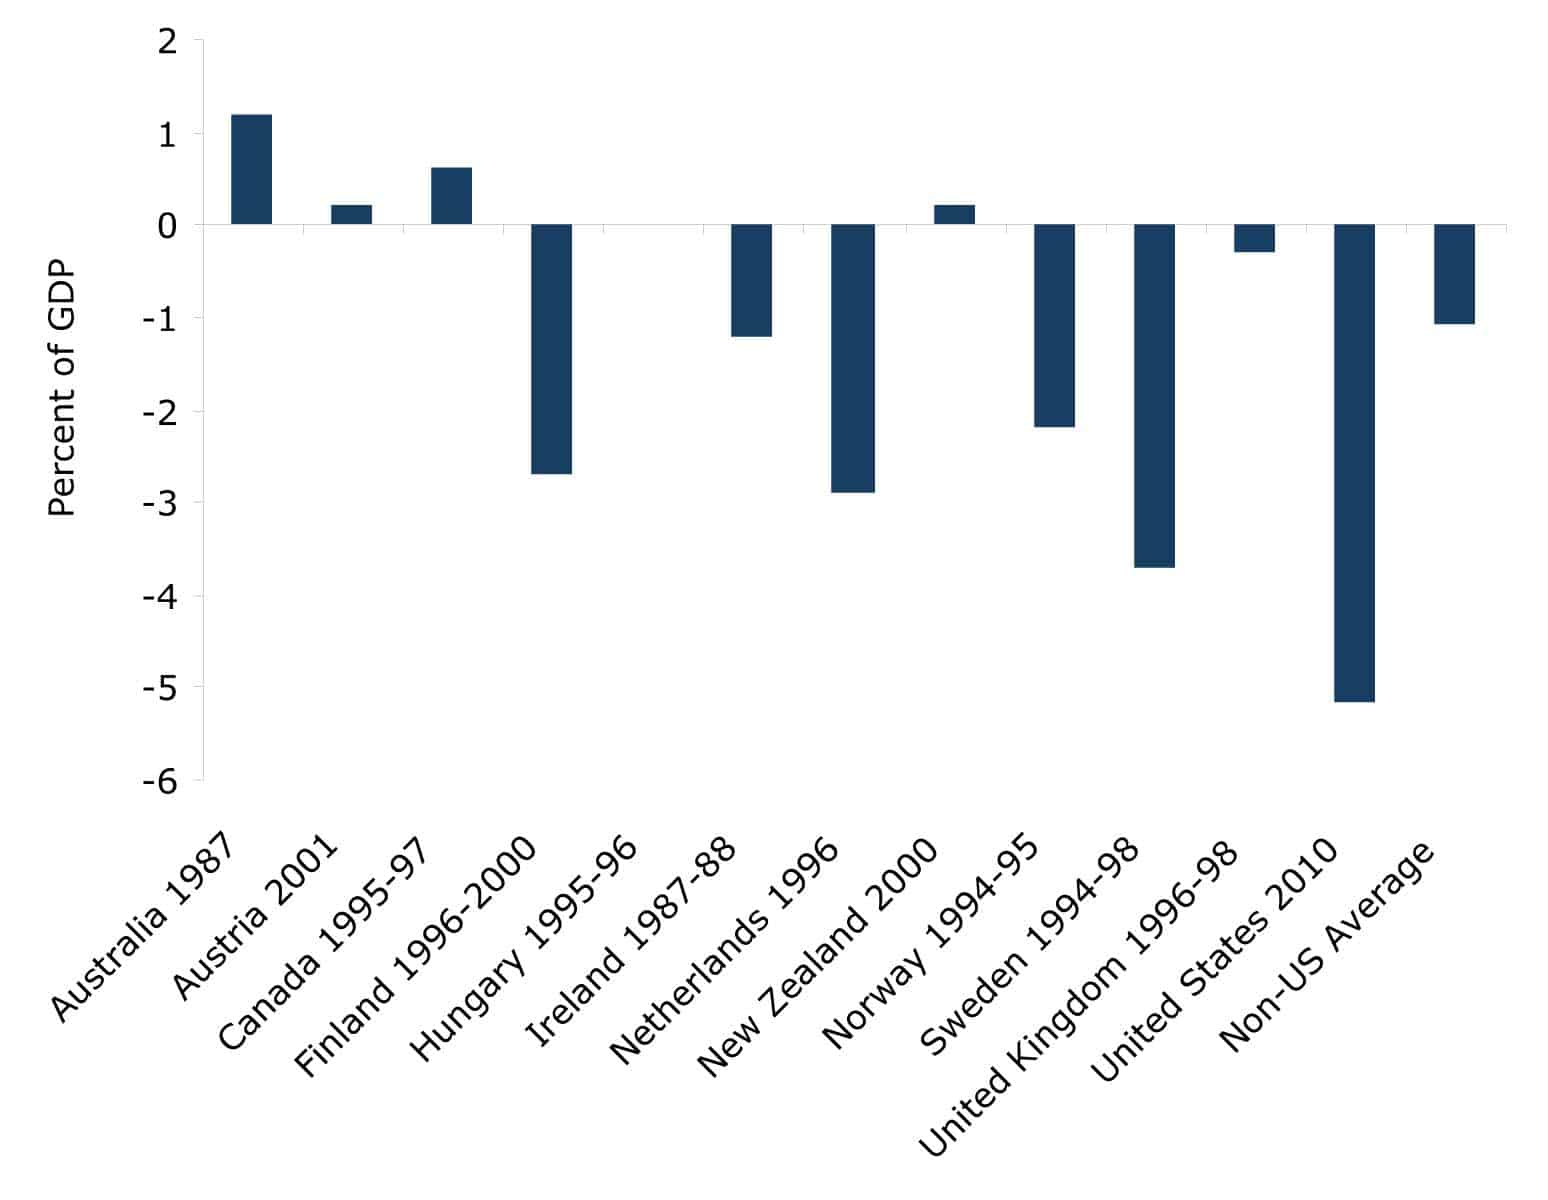
Source: CBO and IMF
Reviewing the cases of fiscal adjustment identified by Broadbent and Daly, several points become evident:
First, as the paper notes, expenditure adjustments are relatively rare. While the paper argues that expenditure adjustments are clearly preferable in the sense of producing better growth outcomes, it identifies almost three times as many tax adjustments as expenditure adjustments. With just 11 spending adjustments in more than 600 country/year observations, expenditure adjustments are clearly not very common. The paper argues that expenditure adjustments have essentially only come about when driven by crises of confidence in which the financial markets were no longer willing to lend to these countries.
The second point is that the cases of adjustment in countries that were substantially below full employment were heavily concentrated in a narrow group of countries during a narrow time period. Four of the six cases where the fiscal adjustments took place when the country was at least two percentage points below potential GDP were in the three Nordic countries of Finland, Norway, and Sweden. The Netherlands accounted for the other two instances.
Four of these six adjustments took place in the mid-1990s, a period of robust growth in most of the world. The other two instances were in Netherlands in 1983 and Norway 2004-2006, both also periods in which the world economy was seeing healthy growth.
The other noteworthy factor about the four countries that have successfully grown through a period of fiscal adjustment, even when they were starting from a point well below potential output, is that these are all relatively small countries that are heavily involved in international trade.
The trade share of GDP in all four of these countries was at least twice the share in the United States in 2008, before trade collapsed as a result of the downturn, as shown in Figure 6. The trade share of Netherlands’ economy is more than three times as large as that of the United States.
FIGURE 6: International Trade as a Percent of GDP 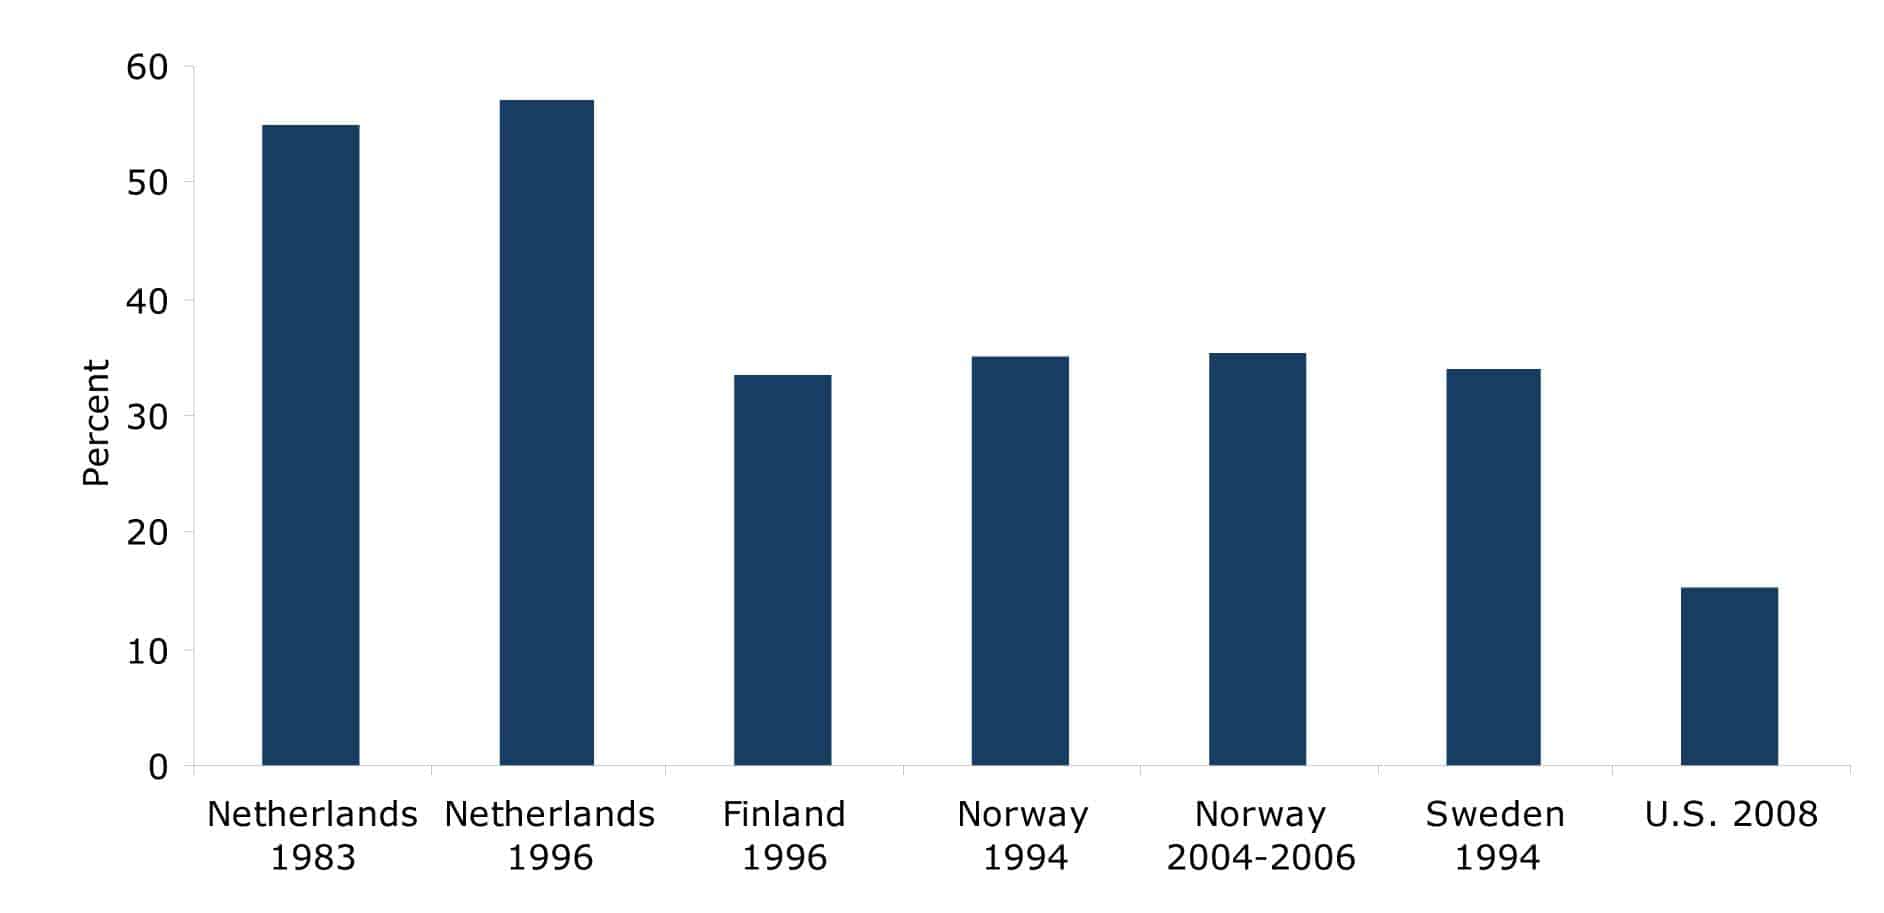
Source: OECD, dx.doi.org/10.1787/824333188522.
This is important for two reasons. First, insofar as trade is driving GDP, it will not be negatively impacted by a fiscal adjustment. The demand from outside of the country will not be reduced by a country’s decision to raise taxes or cut spending. The second reason it is important is that the fiscal adjustment can actually boost trade. A lower deficit can lead to a decline in interest rates, which can in turn be expected to lead to a lower value for the country’s currency relative to that of its trading partners.
This raises the final important difference between the situation of the Broadbent and Daly success stories and the situation of the United States in 2010. It was possible to have substantial reductions in interest rates in these four countries during their six adjustments because their interest rates were relatively high at the time they began their adjustments. Figure 7 shows the interest rate on 10-year government bonds in the year that Broadbent and Daly list as the starting points for their adjustments. The average interest rate for these countries was 7.2 percent. The lowest was 4.4 percent in Norway in 2004-2006.
FIGURE 7: Interest Rate on 10-Year Government Bonds 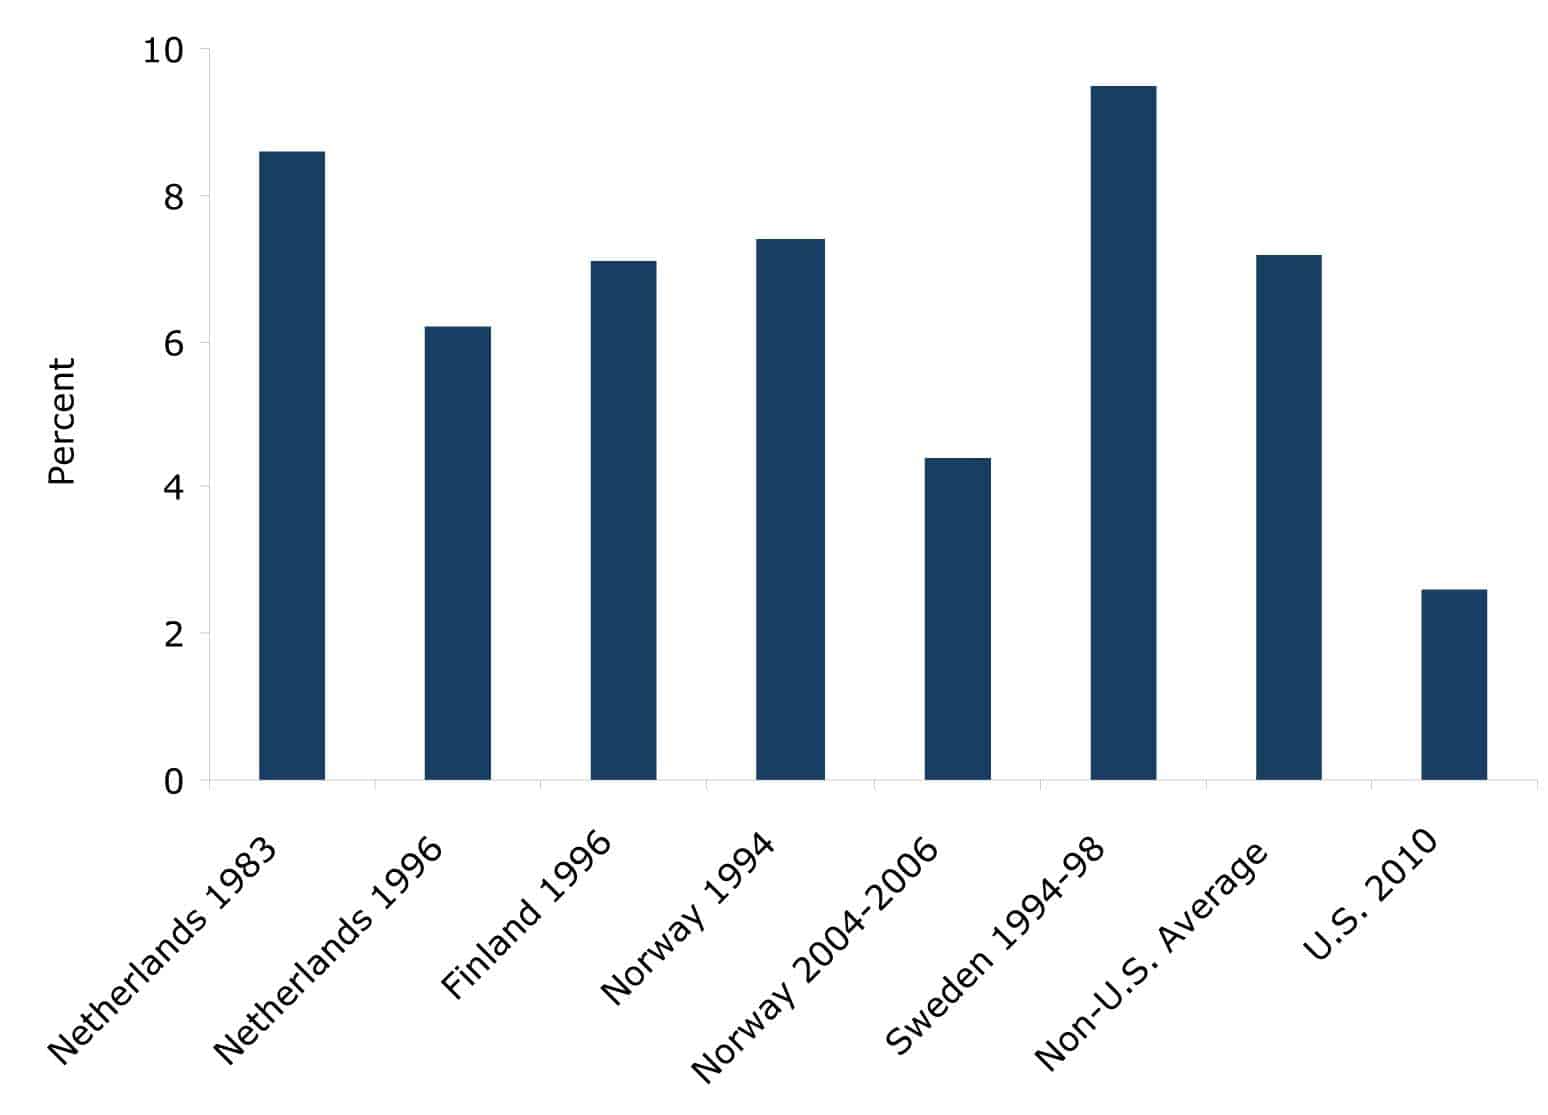
Source: OECD
By contrast, the interest rate on 10-year Treasury bonds in the third quarter of 2010 has averaged less than 2.6 percent.7 It is not plausible that interest rates could decline much further, even in response to the most extreme fiscal adjustment. The short-term rate in the United States is already at zero so it can literally fall no further, and the long-term rate will surely reach a plateau in excess of zero. After more than a decade of deflation, the interest rate on 10-year bonds in Japan is still 0.9 percent, leaving a real yield that is approximately the same as in the United States. Clearly any further decline in nominal interest rates in the United States will be slow under any circumstances and is likely to result in very little change in real interest rates.
In contrast, in the countries cited by Broadbent and Daly there was substantial room for declines in interest rates. With less room for movement in current interest rates in the United States, there is considerably less reason to believe that the boost provided by lower interest rates will be able to offset the contractionary impact of a lower deficit.
Furthermore, there is much less a prospect that whatever decline in interest rates does occur will have as much impact as a comparable decline in interest rates would have had for these countries in their periods of adjustment. On the trade side, the value of the dollar is likely to be far less sensitive to changes in U.S. interest rates than the value of other currencies. This is due to the fact that dollars are largely held as a reserve currency and a safe asset in uncertain times. This demand will be very unresponsive to changes in interest rates. As a result, whatever drop in interest rates does occur as a result of fiscal adjustment may have no measurable effect on the value of dollar. If the drop in interest rates does not lead to a lower dollar, then it cannot increase net exports.
Since the trade share in the United States is considerably smaller than in these other countries, a change in the trade share of comparable magnitude will have less impact on GDP. In other words, if the U.S. had a 10 percent increase in exports and a 10 percent decline in imports, it would have less than half the impact on its GDP as a comparable change in Norway and less than a third of the impact of a comparable change in trade in the Netherlands.
The prospect for large improvements in the trade balance are made even worse by the fact that most of the United States’ major trading partners are also suffering from the downturn. As noted before, four of the six adjustments identified by Broadbent and Daly in countries operating far below potential GDP occurred during the period of robust world growth in the mid-1990s. It is far easier for a country to improve its trade balance when its trade partners are growing rapidly than when they are stagnating.
In short, there is little reason to believe that a fiscal adjustment will lead to a substantial improvement in the United States’ trade position any time in the near future. This channel for offsetting the contractionary impact of deficit reduction is not very promising.
The investment channel does not appear much more promising. With interest rates already at historic lows, it seems implausible that whatever further decline may occur as a result of adjustment could have very much impact. In most sectors output remains far below capacity, so firms have little incentive to expand capacity far in advance of demand. This is especially true because the bubble in non-residential real estate led to enormous excess supply in most areas.
Businesses can invest in modernizing equipment, but the impact of further declines in interest rates is likely to be limited. There is a large body of research that finds that investment is not very responsive to interest rates.8 Furthermore, the rate of growth of equipment and software investment is already quite rapid, with growth averaging 19.9 percent from third quarter of 2009 to the second quarter of 2010. It does not seem likely that lower interest rates will increase this rate substantially, especially in a context where demand is contracting due to budget cuts.
There is one final point that is worth emphasizing about the Broadbent and Daly analysis. The paper pulls out public investment from government spending and treats it as a separate variable. The remaining categories of spending are direct transfer payments or current consumption items such as health care or defense. Although the paper does not emphasize this fact, government spending on public investment is consistently shown to have a highly significant and positive impact on growth.
This suggests both that cutting spending on investment categories of the budget (e.g. infrastructure and research and development) would be contractionary, and that increased spending on these areas would be an effective form of stimulus. The implication of this analysis is that even a paper that emphasizes the virtues of lower budget deficits finds that higher deficits that are used to finance investment lead to more rapid growth in the short run.
Conclusion
There has been a considerable effort to tout the merits of fiscal austerity as a route to restoring growth. This argument has been put forward in direct opposition to arguments for increased stimulus for boosting the economy. While there may be a case that lower deficits can foster growth under some circumstances, the evidence presented in the Broadbent and Daly paper does not suggest that a movement toward lower deficits in the current economic situation in the United States would be expansionary.
Very few of the countries in which fiscal austerity was associated with more rapid growth adopted austerity at a time when the economy was far below its potential level of output. In none of the cases were they are as far below as the United States is today. In all of the cases where there was a substantial output gap, the country was far more engaged in international trade than the United States. Trade provided a source of demand that cannot have anywhere near as large an impact in the United States at present.
Finally, all the countries that successfully used austerity to boost growth had much higher interest rates than the United States does at present. This meant that there was substantial room for rates to decline following the imposition of austerity.
The differences between the United States in 2010 and the countries that have successfully gone the route of fiscal austerity to boost growth are large and are very central to the adjustment process. In short, in the current economic environment, the circumstances do not exist for fiscal austerity in the United States to lead to more rapid growth. While a quick return to normal levels of unemployment may not be important to those who are primarily dependent on profits or run large corporations, for most of the country, it is essential to their well-being.
1 Congressional Budget Office. 2010. “The Budget and Economic Outlook: Fiscal Years 2010-2020.” Washington, D.C.: Congressional Budget Office. Available at www.cbo.gov/ftpdocs/108xx/doc10871/01-26-Outlook.pdf.
2 See Alesina, A. and R. Perotti. 1995. “Fiscal Expansions and Adjustments in OECD Economies.” Economic Policy, 207- 247; and Alesina, A., S. Ardagna, and F. Trebbi. 2006. “Who Adjusts and When? The Political Economy of Reform.” IMF Staff Papers V. 53 Special Issue.
3 International Monetary Fund. 2010. “Will It Hurt? Macroeconomic Effects of Fiscal Consolidation.” Economic Outlook, Chapter 3.
4 For example, in the late 1990s the budget surplus in the United States increased far more than would have been predicted by a normal cyclical adjustment. This was largely attributable to soaring capital gains tax revenue from the stock bubble.
5 Arjun Jayadev and Mike Konzcal did a similar analysis of Alesina’s work. See Jayadev, A. and M. Konczal. 2010. “The Boom Not the Slump: The Right Time for Austerity.” Roosevelt Institute. Available at www.rooseveltinstitute.org/sites/all/files/
not_the_time_for_austerity.pdf.
6 Broadbent, B. and K. Daly. 2010. “Limiting the Fall-Out from Fiscal Adjustments.” Goldman Sachs Global Economics, Global Economics Paper 195.
7 Data on interest rates on U.S. Treasury bonds is available from the Federal Reserve Board at www.federalreserve.gov/releases/h15/.
8 Chirinko, R.S. 1993. “Business Fixed Investment Spending: A Critical Survey of Modeling Strategies, Empirical Results, and Policy Implications.” Journal of Economic Literature (December): 1875-1911.
Dean Baker is co-director of the Center for Economic and Policy Research (CEPR). He is the author of False Profits: Recovering from the Bubble Economy. He also has a blog Beat the Press, where he discusses the media’s coverage of economic issues. This article was first published by CEPR in October 2010 under a Creative Commons license.
| Print
