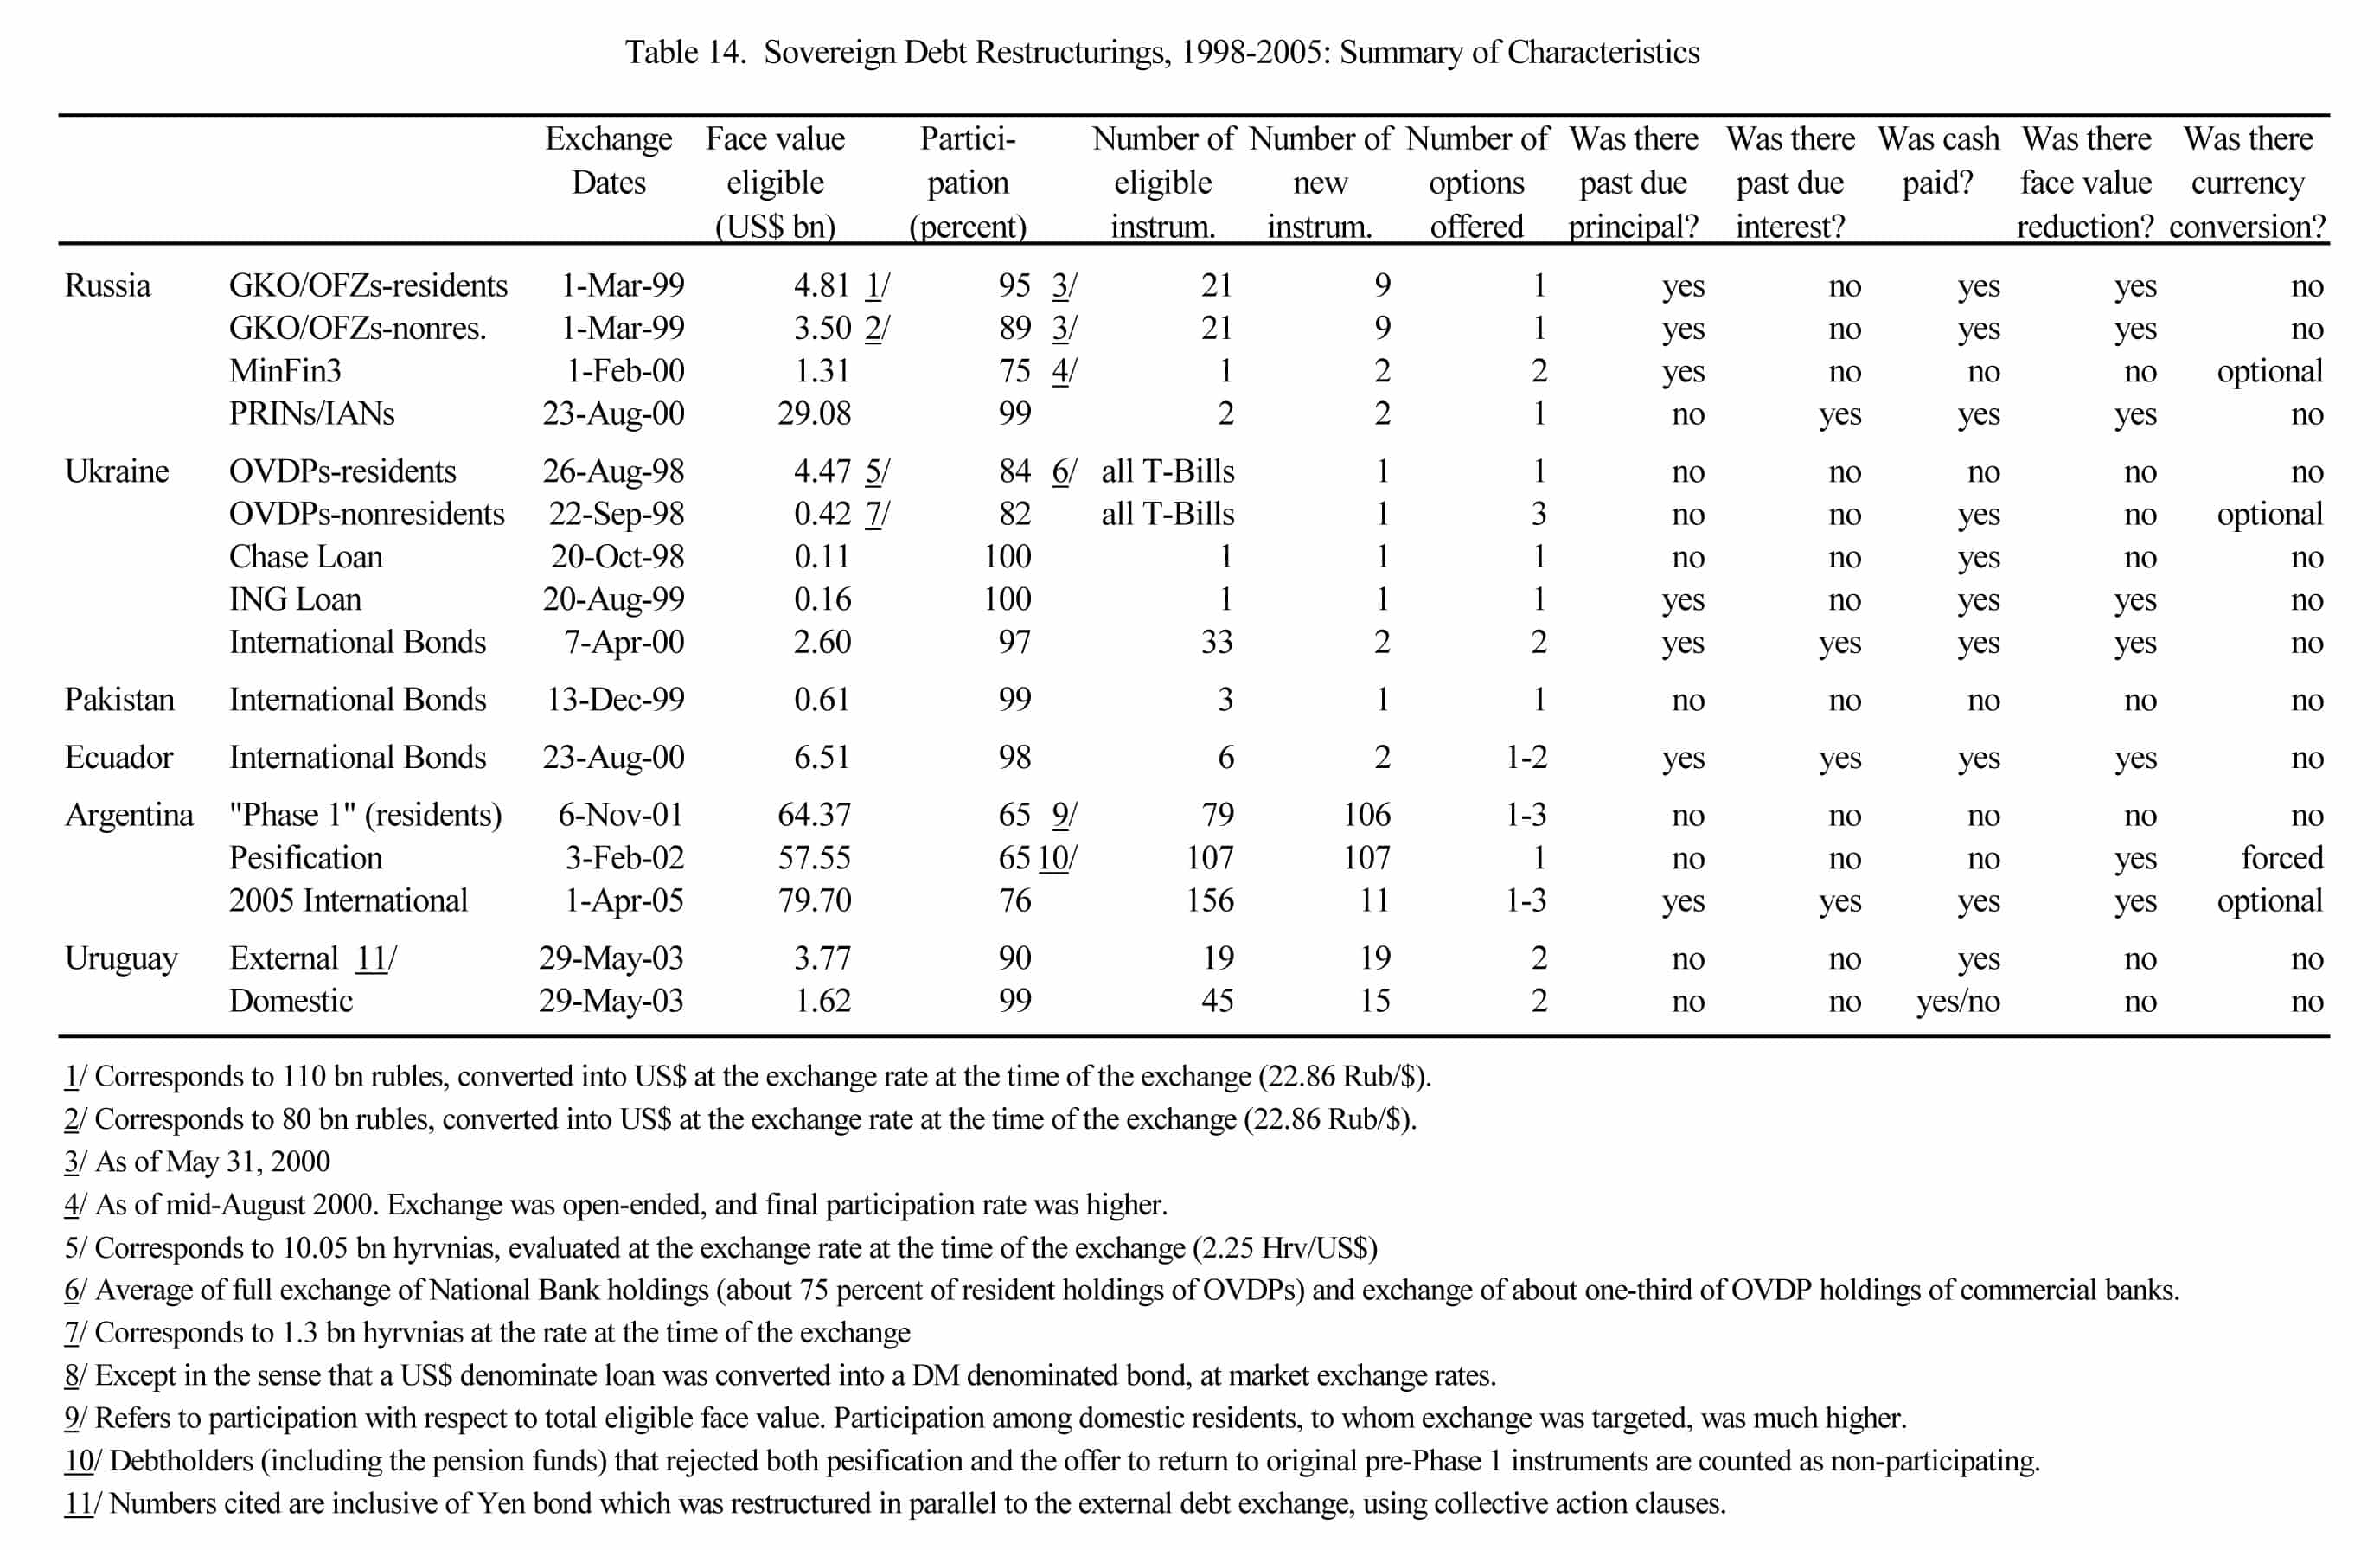
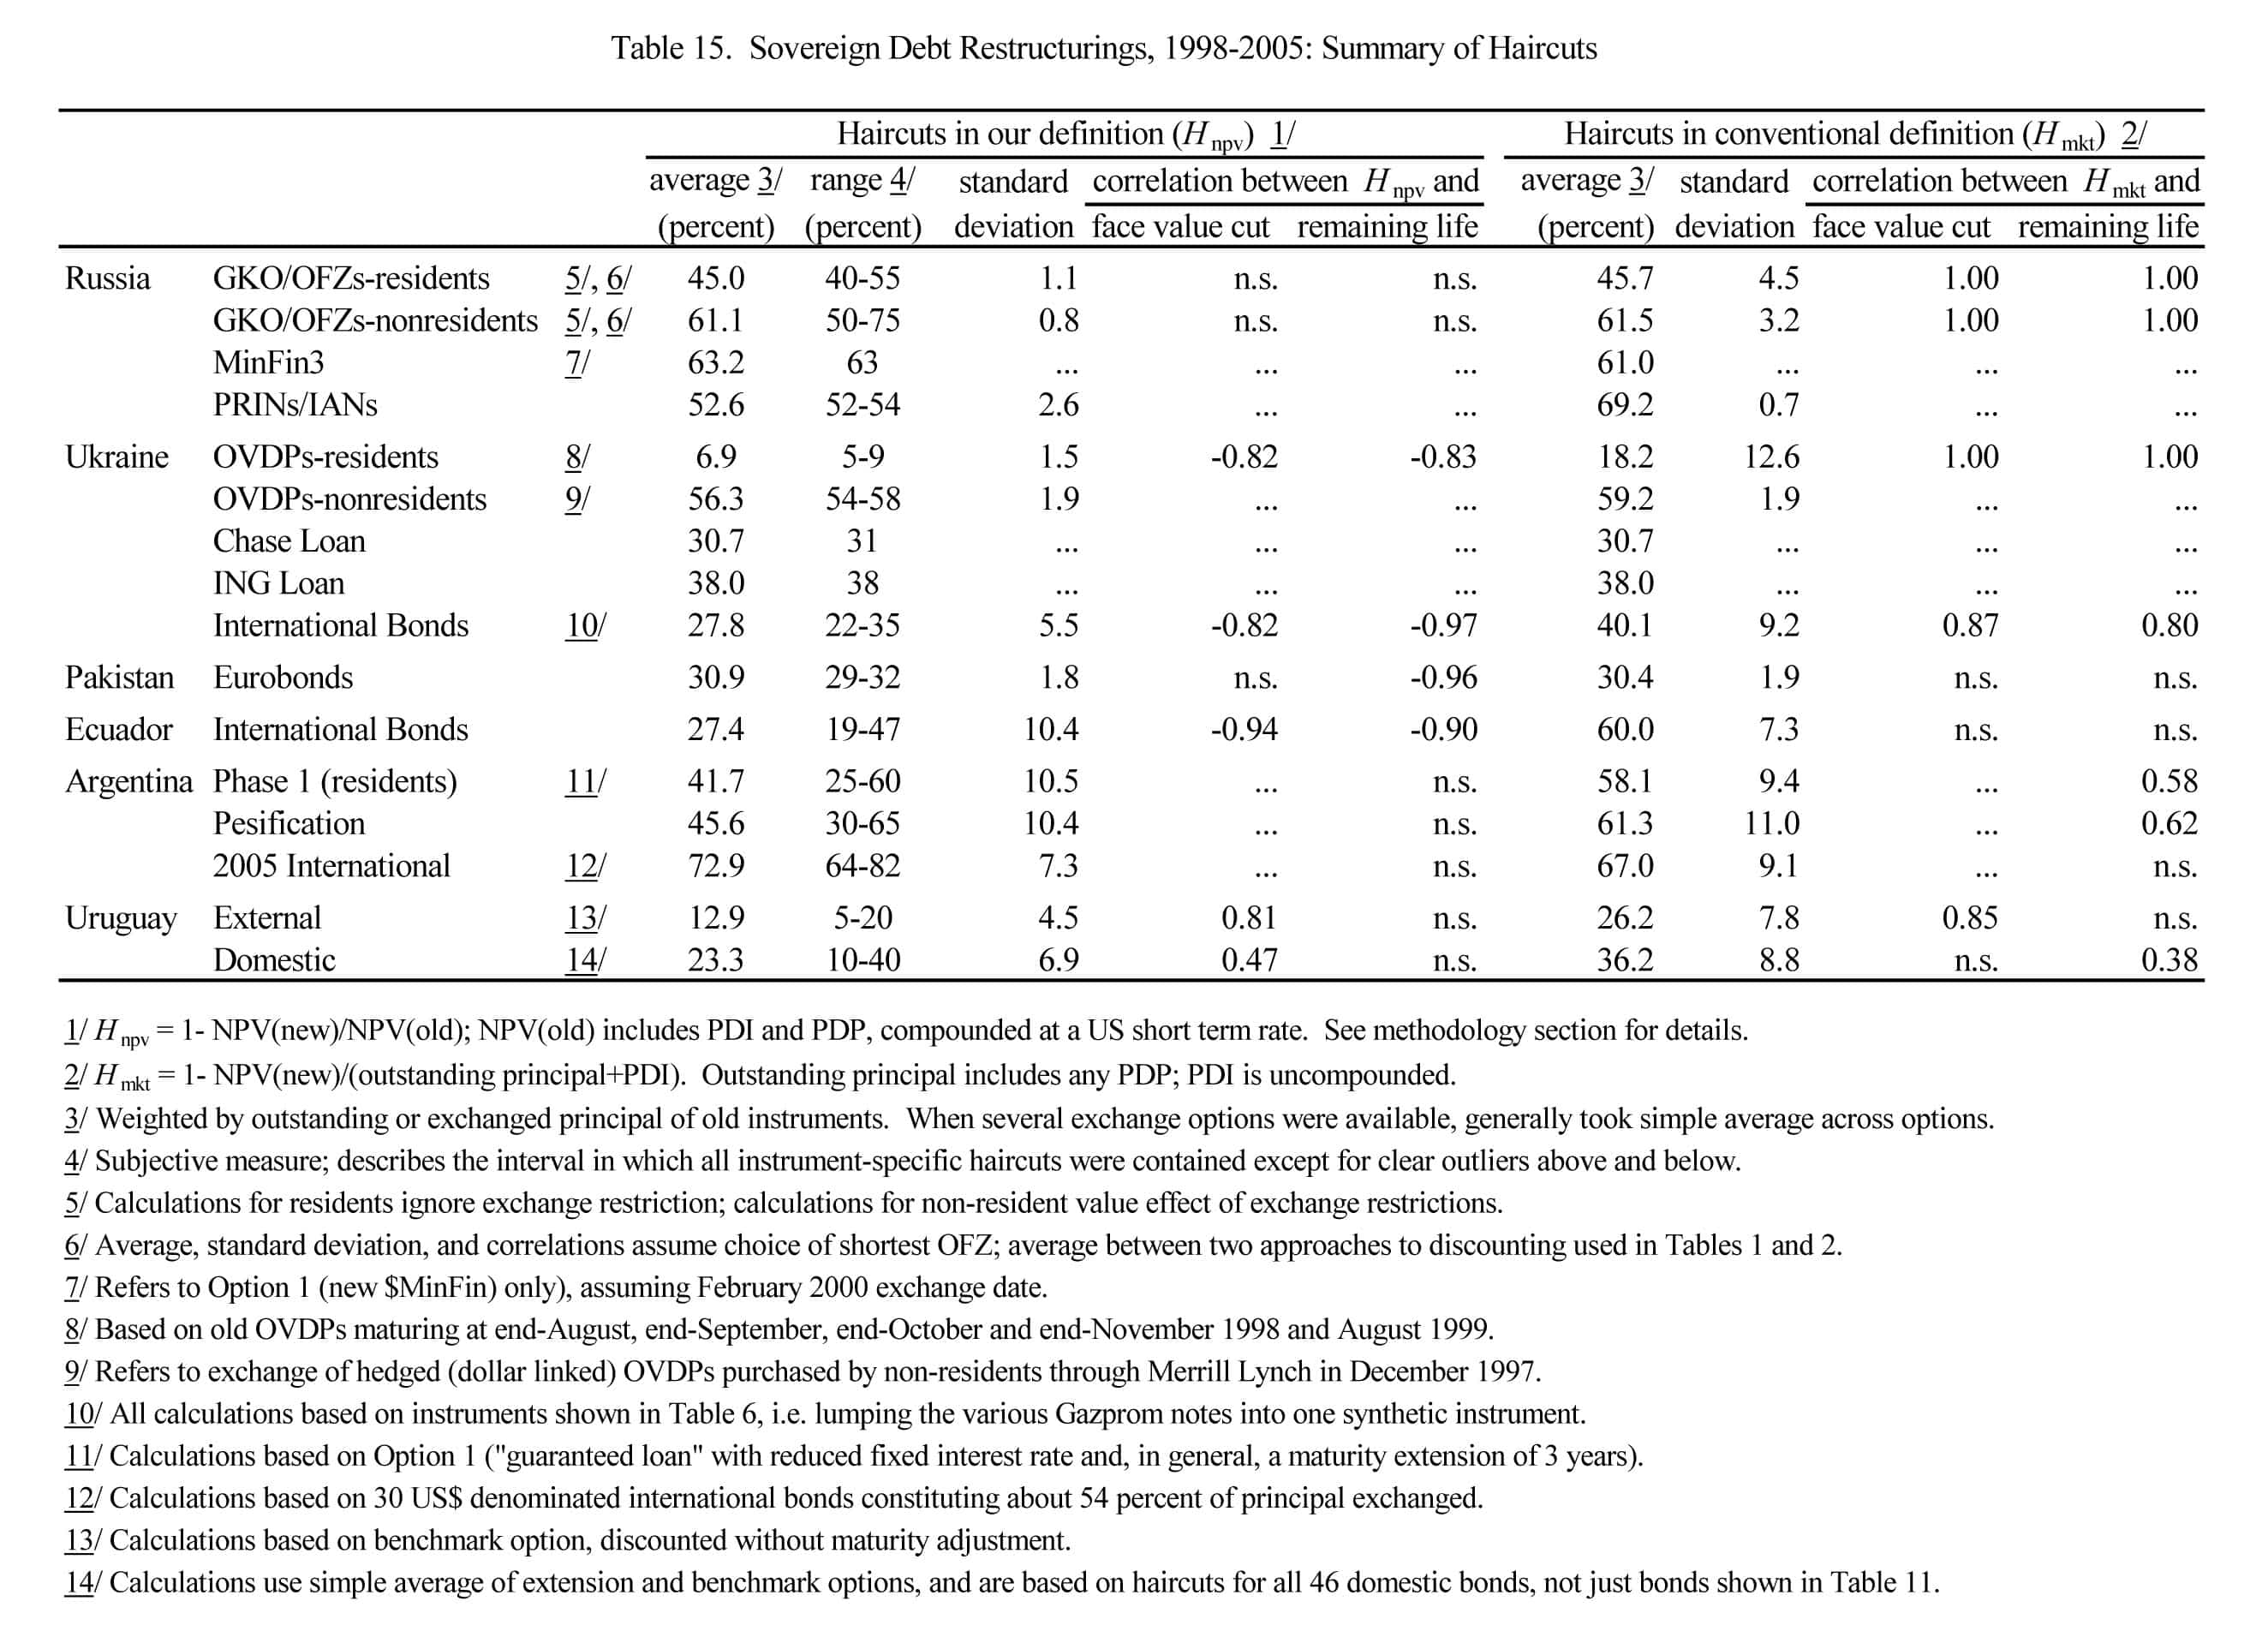
Table 14 summarizes the main technical characteristics of the debt restructurings studied in this paper: the size of the exchange, the participation rate, the numbers of instruments tendered and new instruments issued, the options available to investors, etc. Table 15 contains the main results, both in terms of the level and dispersion of NPV [net present value] haircuts, and contrasts them with the results that result from the application of the more conventional haircuts used by market participants (namely, to compare the NPV of the new instruments obtained with the face value rather than the NPV of the old instruments). In the following, we summarize the main points arising from these tables.
First, as already clear from the preceding sections, there are very large variations in the average level of haircuts across debt restructuring episodes. Among the exchanges targeted to non-residents, Uruguay’s 2003 exchange, with an average haircut of about 13 percent, was the mildest, while Argentina’s 2005 exchange, with haircuts of about 74 percent, was the harshest. Most other restructurings stayed well below and above these upper and lower bounds, respectively, and are clustered in the range between 25 and 55 percent.
Second, haircuts computed according to the financial market convention generally give the appearance of even larger investor losses. This is not surprising, as the conventional definition sets the value of old instruments equal to their face value, which is generally higher than their net present value when discounted at the same — post-restructuring, but generally still high — interest rates that we use to value the new instruments. There is a single exception: Argentina in 2005, which restructured in an exceptionally favorable external environment, and as a result experienced exit yields that were typically lower than the coupon rates of the old instruments (many of which had been issued in an already distressed situation). Hence, in this case, NPV haircuts in our definition are somewhat higher than haircuts computed according to market convention. In addition, there are of course cases when both definitions imply almost the same result; this occurs when the old instrument had very short remaining maturity or had just matured (as was the case, for example, for all or most instruments exchanged in Pakistan’s 1999, Ukraine’s 2000, Russia’s MinFin3, or Ukraine’s Chase and ING loan restructurings).
Third, comparing restructurings targeted to residents and to non-residents does not yield a very clear pattern. In two of the earlier exchanges — Ukraine’s OVDP exchange and Russia’s GKO exchange — residents, according to our results, obtained significantly better deals. However, in the case of Ukraine, residents avoided high overt losses only at the price of obtaining domestic currency instruments that exposed them to capital controls; non-residents received Eurobonds. For Russia, part of the difference between the resident and non-resident haircuts shown in the Table is due to a repatriation restriction that is reflected only in the non-residents’ result (though as we have seen in Section III.A., nonresidents fared somewhat worse even if the repatriation restriction is ignored).
No clear difference in treatment is apparent in the two most recent crises. While the Argentina 2005 exchange, targeted mostly at non-residents, was the harshest of the restructurings covered in this paper, residents holders of the same international bonds that restructured earlier appear to have been treated almost as harshly, since they were first restructured in the November 2001 “Phase 1” exchange, and subsequently “pesified” in February 2002, at a combined loss of close to 70 percent. Finally, during Uruguay’s 2003 exchange, long dated fixed rate domestic instruments held by residents were subjected to about the same, relatively mild, haircuts as international bonds. Shorter dated treasury bills and floating rate bonds suffered higher haircuts, but this could be on account of their shorter durations (see below).
Fourth, as indicated by the standard deviation of haircuts presented in Table 15, there was often considerable variation in the haircuts received by investors within the same exchange or restructuring. This applies particularly to restructurings — like Argentina, Uruguay, Ecuador, and (if one includes the “Gazprom bonds) Ukraine 2000 — in which there was a large degree of heterogeneity in the characteristics of the old instruments that were being tendered. Hence, intercreditor equity was often violated in the sense that the losses suffered could differ widely across creditors within the same exchange. As Table 15 shows, this is not an artifact of the particular definition of haircuts proposed in this paper: a similar result holds if haircuts are evaluated according to the market convention that focuses on the face value of old instruments rather than the net present value of the payments stream that they promise. Indeed, for most exchanges, the within-exchange standard deviation of haircuts according to market convention was slightly higher than that of haircuts in our definition.
Fifth, the correlations shown in Table 15, in conjunction with what we know about the design of the various exchanges, give us an idea of what might be driving some of the within-exchange differences in haircuts across creditors. Almost all exchanges made an attempt to differentiate the package of instruments offered to investors in line with the characteristics of the old instruments traded. In practice, this was done by offering holders of longer old instruments longer new instruments (Argentina; Phase 1, and Pesification), by imposing a larger face value haircut on them (Russia GKO and PRINs/IANs exchange; Ukraine OVDP and 2000 exchanges) or a mixture of both (Ecuador and Uruguay exchanges). Hence, the correlation between haircuts according to market convention — that is, disregarding any differences in maturity and payments terms of the old instruments — and their remaining life is typically positive. Per unit of face value, holders of longer-dated old instruments tended to receive smaller values of new instruments.
However, this seemingly “tougher” treatment of longer instruments almost never translated into less favorable treatment per unit of NPV of the old instruments. As Table 15 shows, the correlation between remaining life and NPV haircuts is either not significant (“n.s.”), or significant and negative. This means that any “tougher” treatment of longer instruments did not, in fact, go far enough in making up for the fact that longer instruments, when evaluated at the high post-exchange yields, had lower value to begin with. As a result, holders of longer instruments ended up with lower NPV haircuts than those of shorter original instruments in four external exchanges: Russia (PRINs/IANs); Ecuador, Ukraine (OVDP and 2000), and Pakistan. In all other cases, there is no significant relationship between remaining life and the NPV haircut. Any remaining cross-instrument differences in haircuts in these cases are either random or due to reasons that are beyond the scope of this paper.
Note also that because the debt restructurings we study in this paper reduced the NPV debt burden through a mix of maturity extensions, interest reductions and face value reductions, there is no clear pattern linking face value reductions and NPV haircuts. Within most exchanges, there is no statistically significant correlation between face value cuts and NPV haircuts. Indeed, in a few cases (Ukraine OVDP, Ukraine 2000, and Ecuador) there is a significant and negative relationship, reflecting the relationship between longer dated instruments and higher face value haircuts discussed above.
Sixth, Brady bond holders seem to have fared better than average bondholders not just in terms of value received (as one would expect) but even in terms of haircuts, i.e. taking into account the fact that Brady bonds had higher values to begin with. This is most pronounced for Argentina, where the holders of Discount Brady bonds got away with haircuts of less than 38 percent, compared to average haircuts on non-collateralized bonds of 74 percent. It is also apparent for Urugay (haircuts of 9-10 percent compared to over 13 on average for holders of non-collateralized bonds) and Ecuador (19-27 percent compared to 32 percent). These differences are driven by the much higher cash received by Brady bond holders as a result of the release of their principal collateral, which outweighed the effect of the collateral in boosting the value of the old bond (in particular, given low exit yields for Urugay and Argentina). Debtors could have offset these higher cash payments by offering Brady bond holders a correspondingly smaller number of units of the new bonds, but in practice, this was not done. In Uruguay and Argentina, Brady bond holders received the same number of “nominal units” as everyone else. In Ecuador, holders of long dated Brady bonds received a smaller number of units (that is, a higher face value haircut) but this was no enough to offset the higher value, compared to non-collateralized bonds, arising from the release of the principal collateral.
Finally, it is worth noting that most exchanges studied in this paper led to participation rates above or around 90 percent (Table 14). Hence, the free rider or holdout problem seems to have been successfully dealt with in most exchanges. Possible exceptions are the two most recent Argentina restructurings, namely pesification, and the 2005 exchange (participation in “Phase 1”, though nominally only 65 percent of all eligible claims, was much higher among the domestic claim-holders that were targeted by the exchange). As far as pesification is concerned, the relatively low participation rate reflected mainly resistance from the pension funds, while the 2005 participation rate of 76 percent was attributable to low (63 percent) participation by non-resident creditors (among residents, participation was 98 percent). This said, even the comparatively low 76 percent average participation rate surprised many market observers, who had been predicting participation rates in the 50-60 percent range in view of the tough terms of the exchange offer (see, for example, Economist Intelligence Unit, Argentina: Finance Outlook, November 10, 2004).
Federico Sturzenegger is President of the Banco Ciudad de Buenos Aires. Jeromin Zettelmeyer is Director for Policy Studies at the European Bank for Reconstruction and Development. The text above is an excerpt from Federico Sturzenegger and Jeromin Zettelmeyer, “Haircuts: Estimating Investor Losses in Sovereign Debt Restructurings, 1998-2005” (International Monetary Fund Working Paper, July 2005); it is reproduced here for non-profit educational purposes. This paper may be downloaded at the IMF Web site: <www.imf.org/external/pubs/ft/wp/2005/wp05137.pdf>. See, also, Eduardo Levy-Yeyati and Ugo Panizza, “The Elusive Costs of Sovereign Defaults” (Inter-American Development Bank Research Department Working Paper #581, November 2006); Samir Amin, “Managing the Euro: Mission Impossible!” (MRZine, 17 June 2010); Luiz Carlos Bresser-Pereira, “Greek Debt: Default or Restructuring?” (MRZine, 10 July 2010); Yanis Varoufakis, “A Modest Proposal for Overcoming the Euro Crisis” (MRZine, 5 November 2010).
| Print


