The Consumer Price Index rose 0.3 percent in September, and at a 4.8 percent annualized rate over the last three months. Core consumer prices slowed to 0.1 percent compared with 0.2 percent the previous two months. Rounding hid much of the measured fall in core inflation as prices rose at a 0.7 percent annualized rate in September, compared with 2.9 percent in the three months from May to August.
Energy prices again accounted for most of the difference between headline and core inflation. Energy commodities in particular rose at a 40.5 percent annualized rate over the last three months. These prices fell at a 19.2 percent annualized rate over the previous three.
The core disinflation in September was broadly based. Shelter prices rose 0.1 percent after a 0.2 percent rise last month. Though the fall in inflation is modest, shelter accounts for more than 40 percent of the core consumer price index. Apparel prices — which are always erratic — fell 1.1 percent, erasing August’s 1.1 percent rise.
The price of new and used vehicles fell 0.2 percent in September. For the third consecutive month, new car prices stayed flat after growing at a 10.1 percent annualized rate from March to June. As discussed previously, the earlier burst of inflation and current lack thereof is certainly due to the later release of the new model year cars and supply disruptions in Japan. The unusual timing is also seen in the used car market as delayed purchases temporarily had restricted the supply of trade-ins. September used car prices fell 0.6 percent.
The index of core finished producer goods rose 0.8 percent in September in large part due to energy. The price of finished energy goods rose 2.3 percent — but following three months of decline, remains 1.3 percent below its peak in May. Core finished goods prices rose only 0.2 percent in September and at a 3.0 percent annualized rate over the last three months.
The pattern of rebounding energy prices and more modest core inflation is the same at earlier stages of production. The price of core intermediate goods rose 0.2 percent, while the more volatile core crude goods index rose 1.0 percent. The latter was driven by a 10.4 percent jump in certain nonfood materials used in manufacturing, which followed a cumulative decline of 15.5 percent since April.
With the release of the September price data, we now know the 2012 cost-of-living adjustment for Social Security and Supplemental Security Income benefits. From the third quarter of 2008 to the third quarter of 2011, the Consumer Price Index for Urban Wage Earners (CPI-W) rose 3.6 percent. For a retiree receiving $1,115 per month, the COLA will add $482 to annual benefits in 2012.
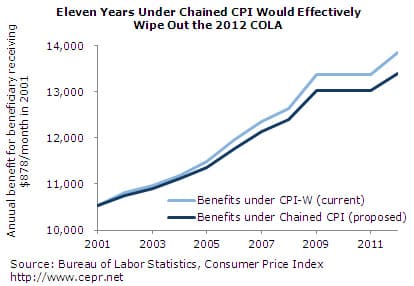
It is worth noting that some have proposed cutting benefits by calculating the COLA based on the chained CPI (C-CPI-U) rather than the CPI-W. If this policy had been in place today, beneficiaries would receive only a 2.8 percent COLA next year. Over time, these smaller COLAs would add up. Compared with current law, a retiree who received $878 per month in 2001 would, in 2012, see his/her annual benefit decrease by $462 (3.3 percent) under the chained CPI.
Proponents argue that the CPI-W overstates inflation, making the switch to the chained CPI a merely technical change. The purpose of the switch, however, is to reduce benefits. The experimental inflation index for the elderly (CPI-E) for example, ran at an even faster rate than the CPI-W between 1997 and 2011. The same retiree seeing $462 lower annual benefits under the chained CPI would see instead $230 higher benefits under the CPI-E.
Despite only modest inflation, the real hourly wage fell again in September. Absent significant employment gains and the increase in real wages indicative of a tighter labor market, it will be difficult for households to climb out of debt. Nor will there be any need for a tightening of monetary policy, at least as long as the threat of wage-driven inflation remains absent.
David Rosnick is an economist at the Center for Economic and Policy Research in Washington, DC. This article was first published by CEPR on 19 October 2011 under a Creative Commons license.
var idcomments_acct = ‘c90a61ed51fd7b64001f1361a7a71191’;
var idcomments_post_id;
var idcomments_post_url;

