The information contained within the 2017 edition of the National Footprint Accounts, and especially its elegant publishing platform, will be useful to critics of the status quo maintained by the major capitalist economic powers. To make sense of the data critically, however, one must go far beyond the explanation given below, as root causes are dealt with superficially at best. —Ed.
In 1970, people first used more environmental resources than the world could produce.
The gap between demand and nature’s ability to meet that demand has grown steadily since then. Each year we live in ecological deficit–taking more than can be replenished–we draw down the world’s reserves of natural resources. Ensuring we don’t use up the world’s resources is a global effort, though some countries use up more resources than others.
We wanted to know what countries were the heaviest users of environmental resources, and which ones have the lightest footprint.
We used data from our partner, Global Footprint Network–a research group dedicated to helping leaders in government and finance quantify how much people take from nature and how much nature has to give. Each year they release the National Footprint Accounts, a ledger of the resources each country gives and takes.
The 2017 edition of the National Footprint Accounts contains data from 1961 through 2013, and is available on data.world, where you can query, download, and comment on the data. The data.world platform helps people join, explore, and visualize data from disparate sources to create new knowledge and solve tough problems. Thousands of datasets already live on data.world, with users adding more every day. You can also follow Global Footprint Network on data.world to get notifications when new datasets are available.
Not surprisingly, we found that on average people across the world use vastly more resources than nature can replace.
Countries in Western Europe, East Asia and oil-producing countries typically run the largest per person deficits. Luxembourg has a per person deficit 10 times larger than the world average. Sparsely populated and densely forested South American countries like Guyana, Suriname and French Guiana have the largest per person surpluses.
We saw that a country’s affluence is a strong predictor of its natural resource consumption. Looking just at the 50 largest economies, Canada is the most environmentally responsible and South Korea the least. Of these large economies, the United States has the second worst environmental track record.
Ecological footprint measures how much biologically productive area a country needs to fuel its resource consumption and absorb its waste.
The more fruits, vegetables and grains a country consumes the more farmland it needs to supply that demand. The more animal product it consumes, the more fishing and grazing area it needs. The more carbon emissions it puts out, the more land it needs to pull that carbon back out of the atmosphere and trap it. If you’re concerned with the environment, having a large ecological footprint is a big negative.
On the other hand, “biocapacity” is a positive for the environment. Biocapacity measures how much a country’s land and water can produce.
Densely forested land can be logged for lumber, or left to convert carbon in the air into leaves and stems on the ground. Farmers need land to grow crops or raise livestock. How much the land can provide depends on both how rich it is, and what people use it for.
Both ecological footprint and biocapacity are measured in a common unit, global hectares. A global hectare is the average amount of resources a hectare (roughly two and a half acres) of productive land produces.
We began by looking at total resource consumption to see which countries have the largest (and smallest) ecological footprints. The biggest consumers are among the most populous, most expansive, and most developed countries in the world. Small island countries make up the other extreme.
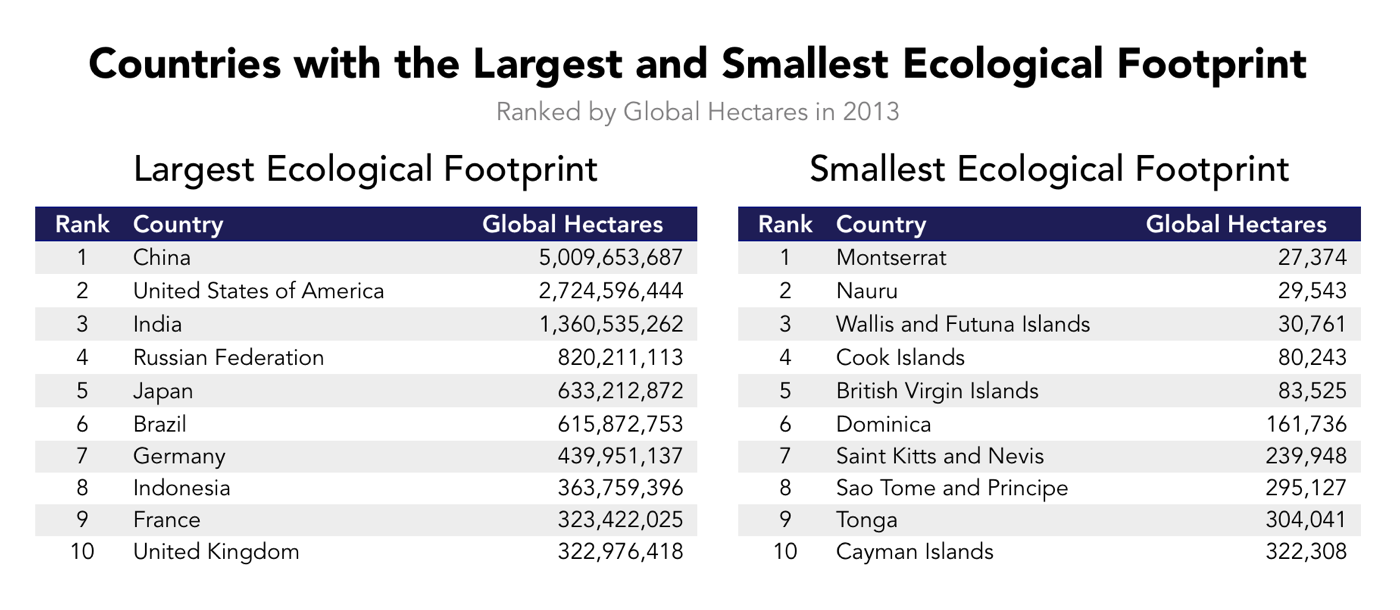
The absolute amount of demand falls rapidly the further down the list. The United States ranks second largest, with just over half the demand of number one China. India, the next largest, consumes about half what the United States does. Two more spots down the list, Japan comes in at fifth largest with half the demand of India. Rounding out the top 10, the United Kingdom has a footprint half the size of Japan’s footprint–and roughly one-sixteenth the size of China’s footprint.
It’s not very surprising, however, that countries with the most people also have the largest footprints. But if you control for population, which countries use the most per person?
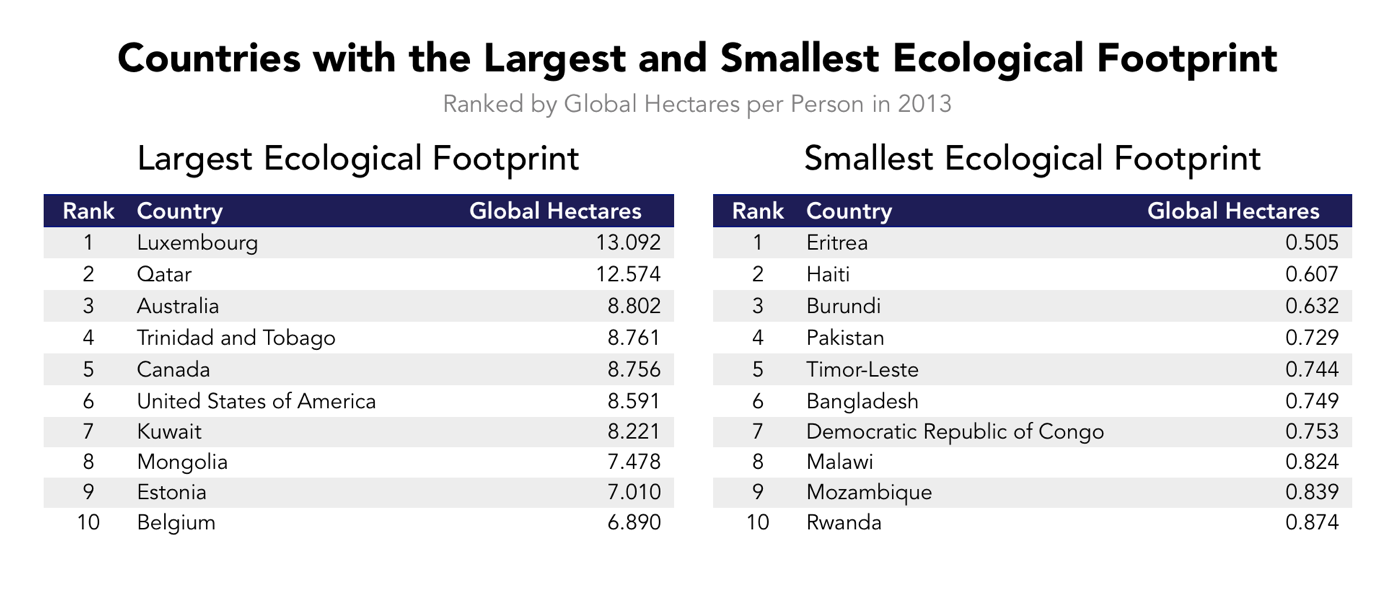
Luxembourg, a country with a little over half a million people and just under a thousand square miles, sits atop the list. Each Luxembourger uses the equivalent of 13.092 hectares of productive land. The bottom 10 countries, on the other hand, need less than one global hectare per person. It takes approximately 26 Eritreans to match one Luxembourger’s ecological footprint. Island countries, such as Timor-Leste in the south Pacific or Trinidad and Tobago in the Caribbean, show up at both extremes.
Countries use natural resources in different ways. Different spending habits means a country has to sacrifice different things to start living within its means again. We found the 10 countries that put the largest burden on the earth, and show how they spend their resources.
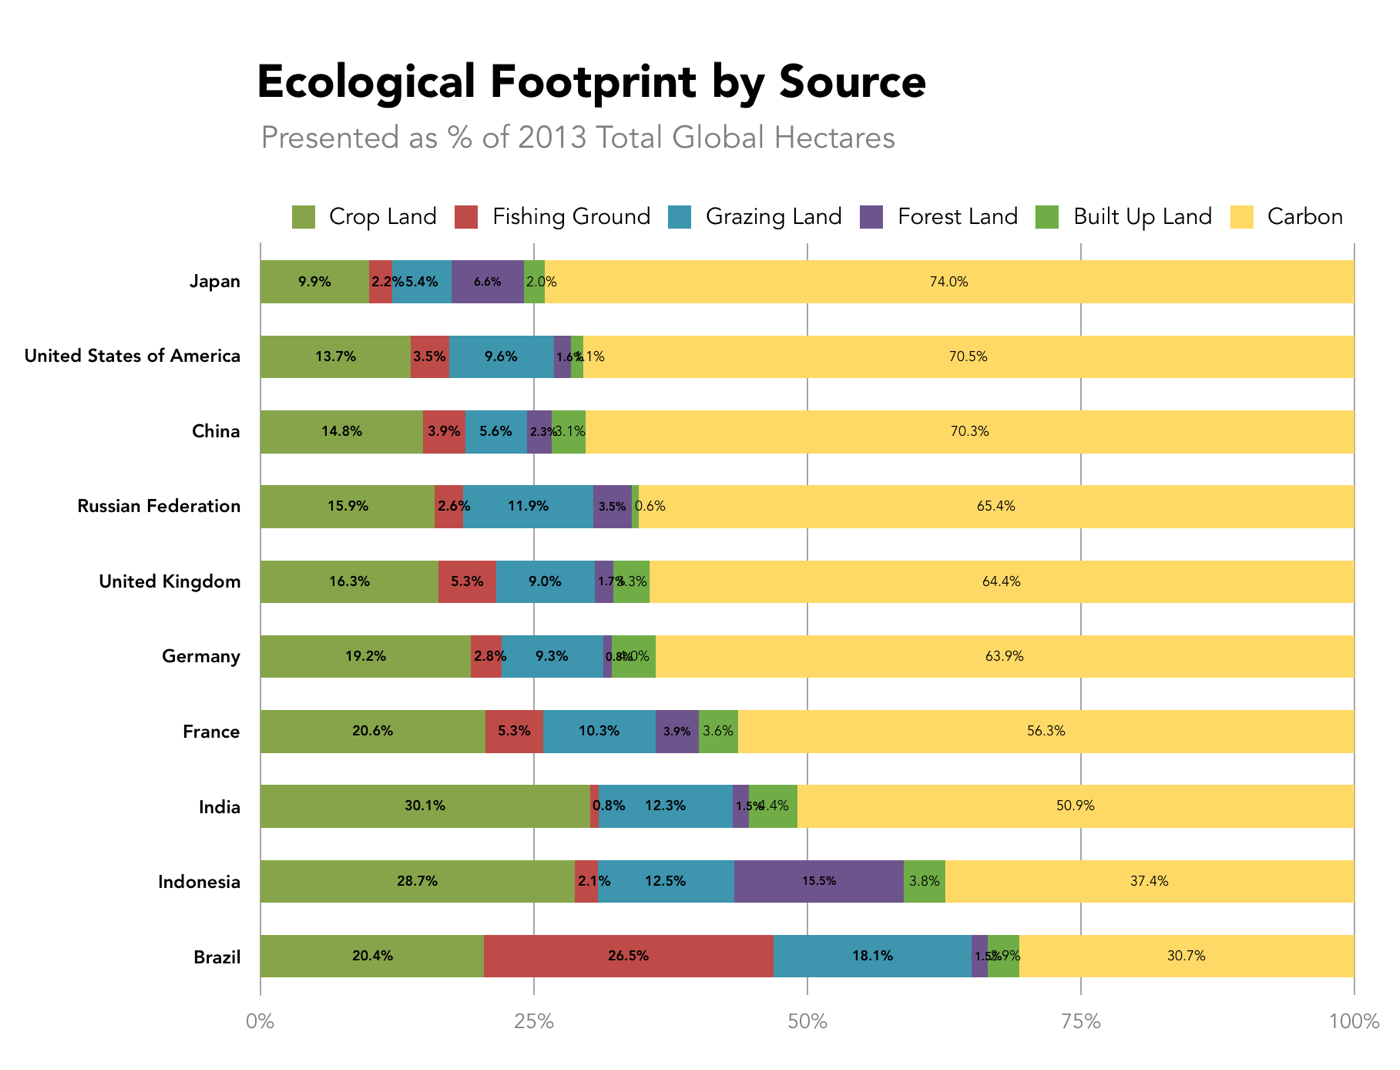
Carbon emissions are the largest demand most countries place on natural resources. Typically discussions about carbon emissions revolve around tons of carbon. The ecological footprint measures carbon in the amount of productive land and sea needed to pull the carbon out of the air. Indonesia and Brazil place a heavier burden on their resources for food production than removing carbon. For the 10 countries with the largest footprint, growing food makes up the second largest part of demand.
Consumption is only half of the equation. A country that consumes less than it produces will have resources to export. So, which countries are rich in environmental resources and don’t have large ecological footprints?
To begin with, we investigated who had the most in terms of sheer natural resources. The table below shows the countries with the most and least biocapacity:
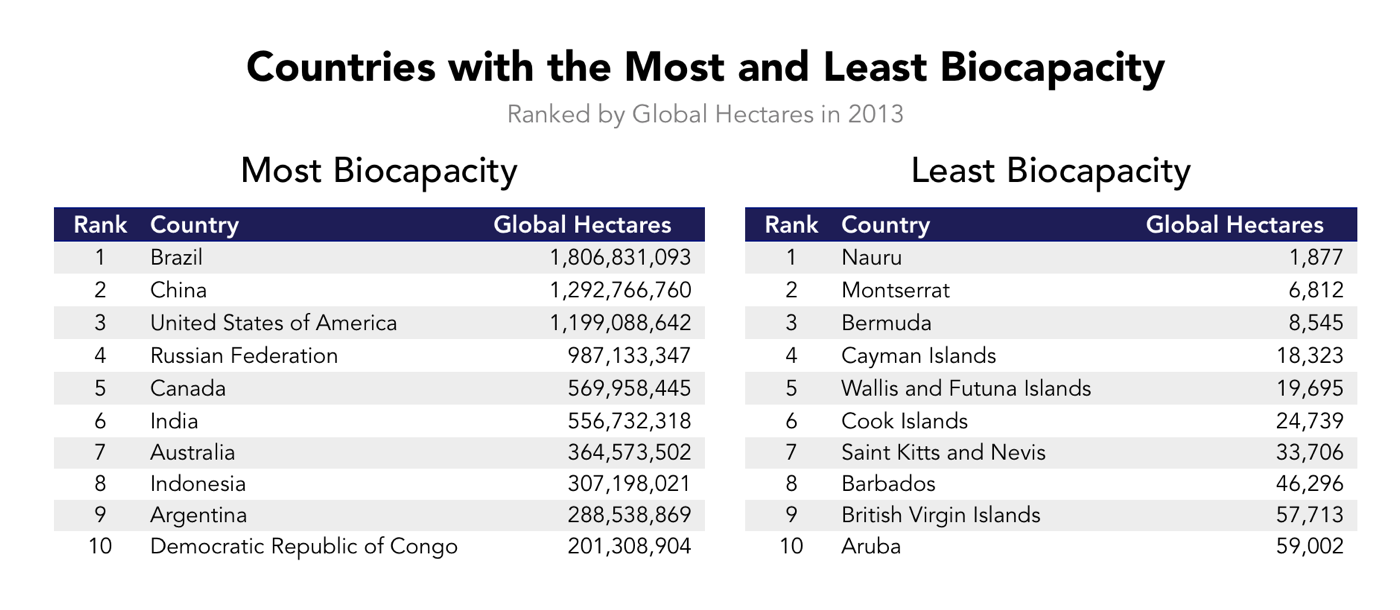
As could be expected, many of the countries that have the most productive land are also some of the largest countries by area. Eight out of 10 are also in the 10 largest countries by area. Indonesia and the Democratic Republic of Congo are the two that fall below top 10 by area. Like we’ve seen above, the chart of the least biocapacity is a list of the smallest island countries.
Sorting countries by the amount of resources their populations use on average drastically changes who comes out on top. Many of the largest, most resource rich countries also happen to have large populations.
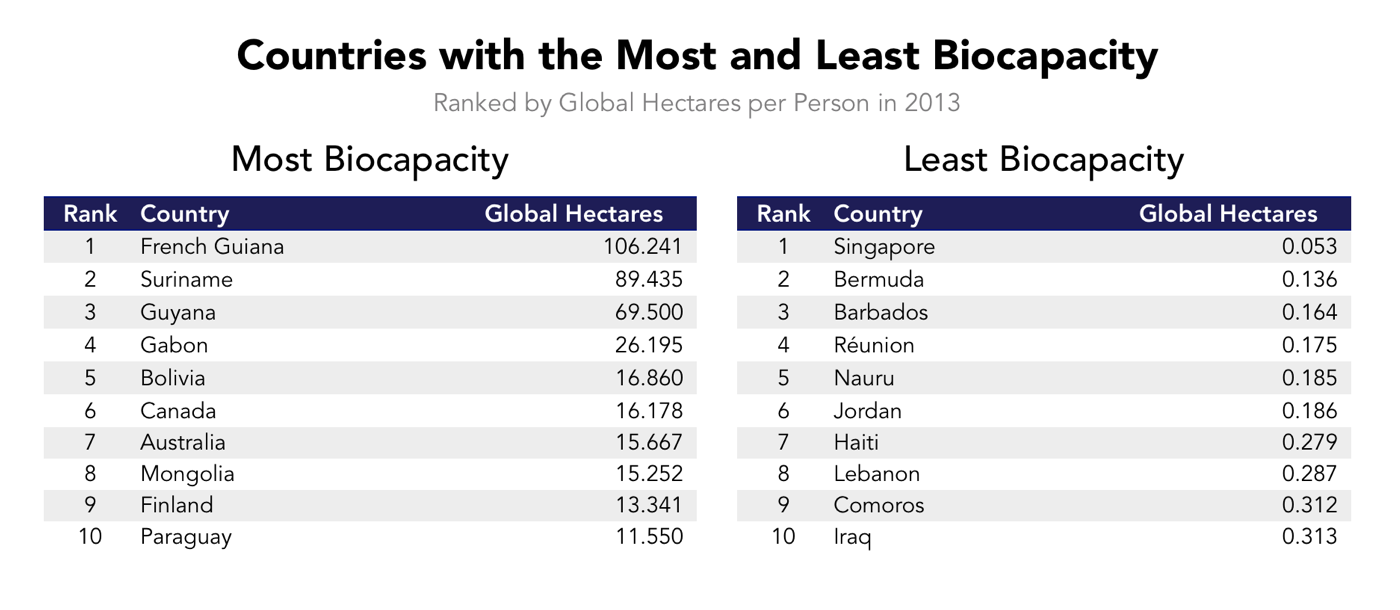
Citizens of large, sparsely populated countries, such as those of French Guiana, have their footprints made up for several times over by the lush vegetation in their countries. A couple of the countries that top the list of ecological consumers–Australia and Canada–appear in the top 10 for most biocapacity as well. Densely populated and sparsely-vegetated countries like Singapore and Jordan have few resources to spread across their populations.
Several different resources contribute to a country’s overall biocapacity. Managing these resources helps countries remain as overall producers of biocapacity. We looked at the 10 countries that replenish the most resources to see how they break down.
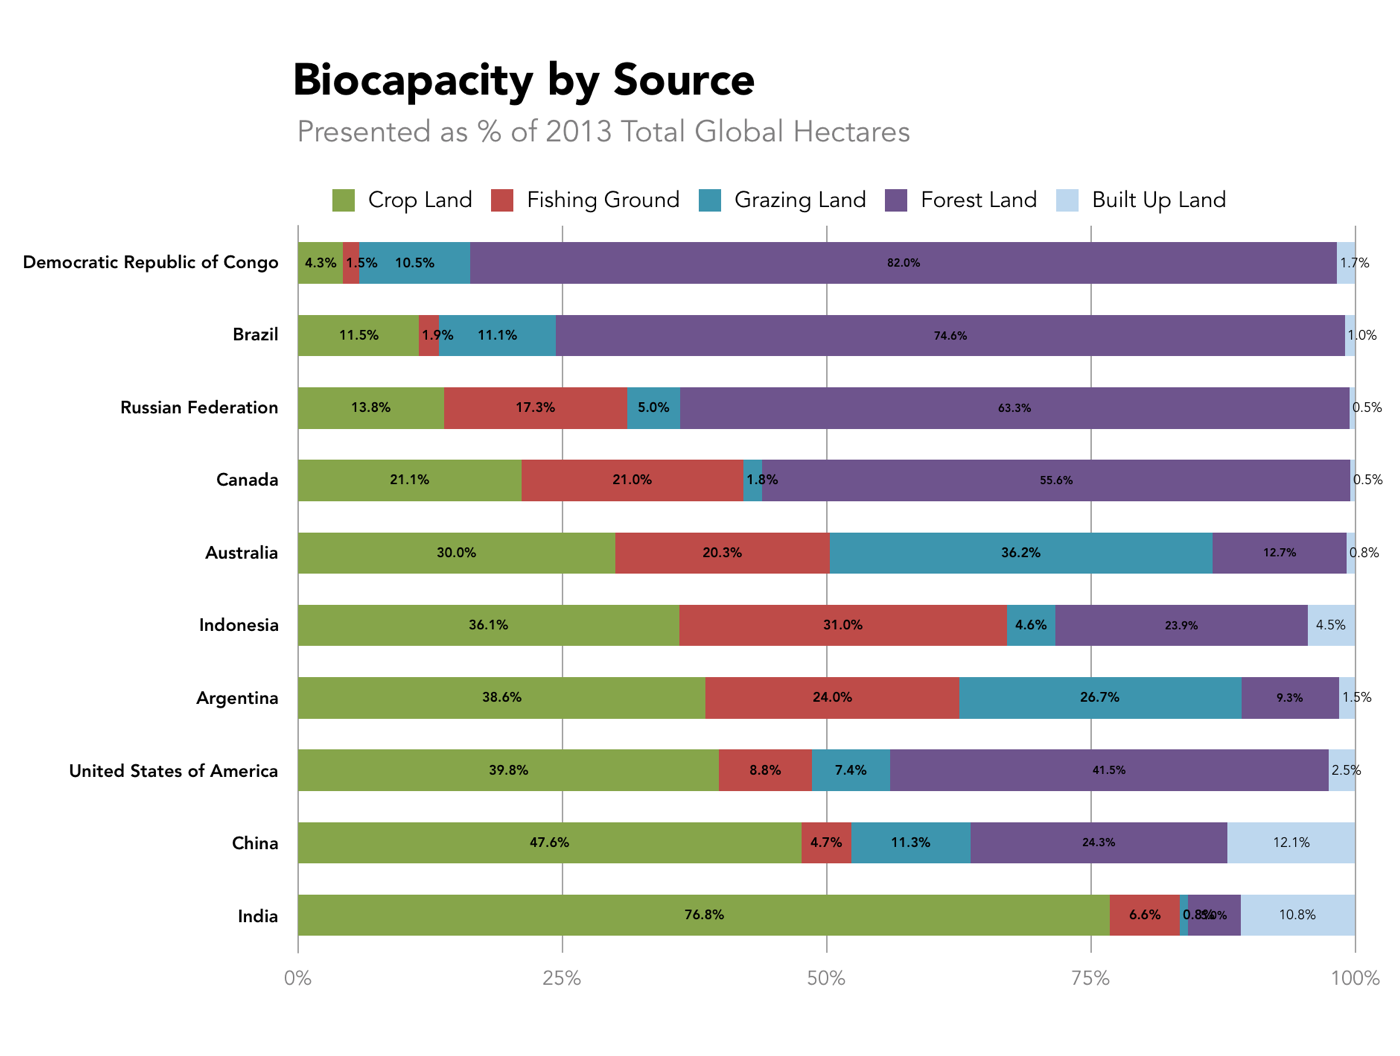
Forest land is capable of absorbing large amounts of carbon. The forests in the Congo and Brazil, two of the most resource rich countries, generate over three quarters of their available natural resources. Land used for food production–growing crops, raising livestock, or fishing–provides over half of the resources available from six of the ten most resource rich countries. Built-up land contributes a nearly negligible portion.
After ranking countries by the size of their demand for natural resources and the size of the country’s ability to produce and replenish those resources, we wanted to know which countries live within their ecological means, and which countries rack up ecological debt.
To do this, we subtracted a country’s ecological footprint (how much it takes from the environment) from its biocapacity (how much it puts back into the environment) to find its net biocapacity in global hectares per person. Below are the top ecological creditors and debtors ranked by net per capita footprint.
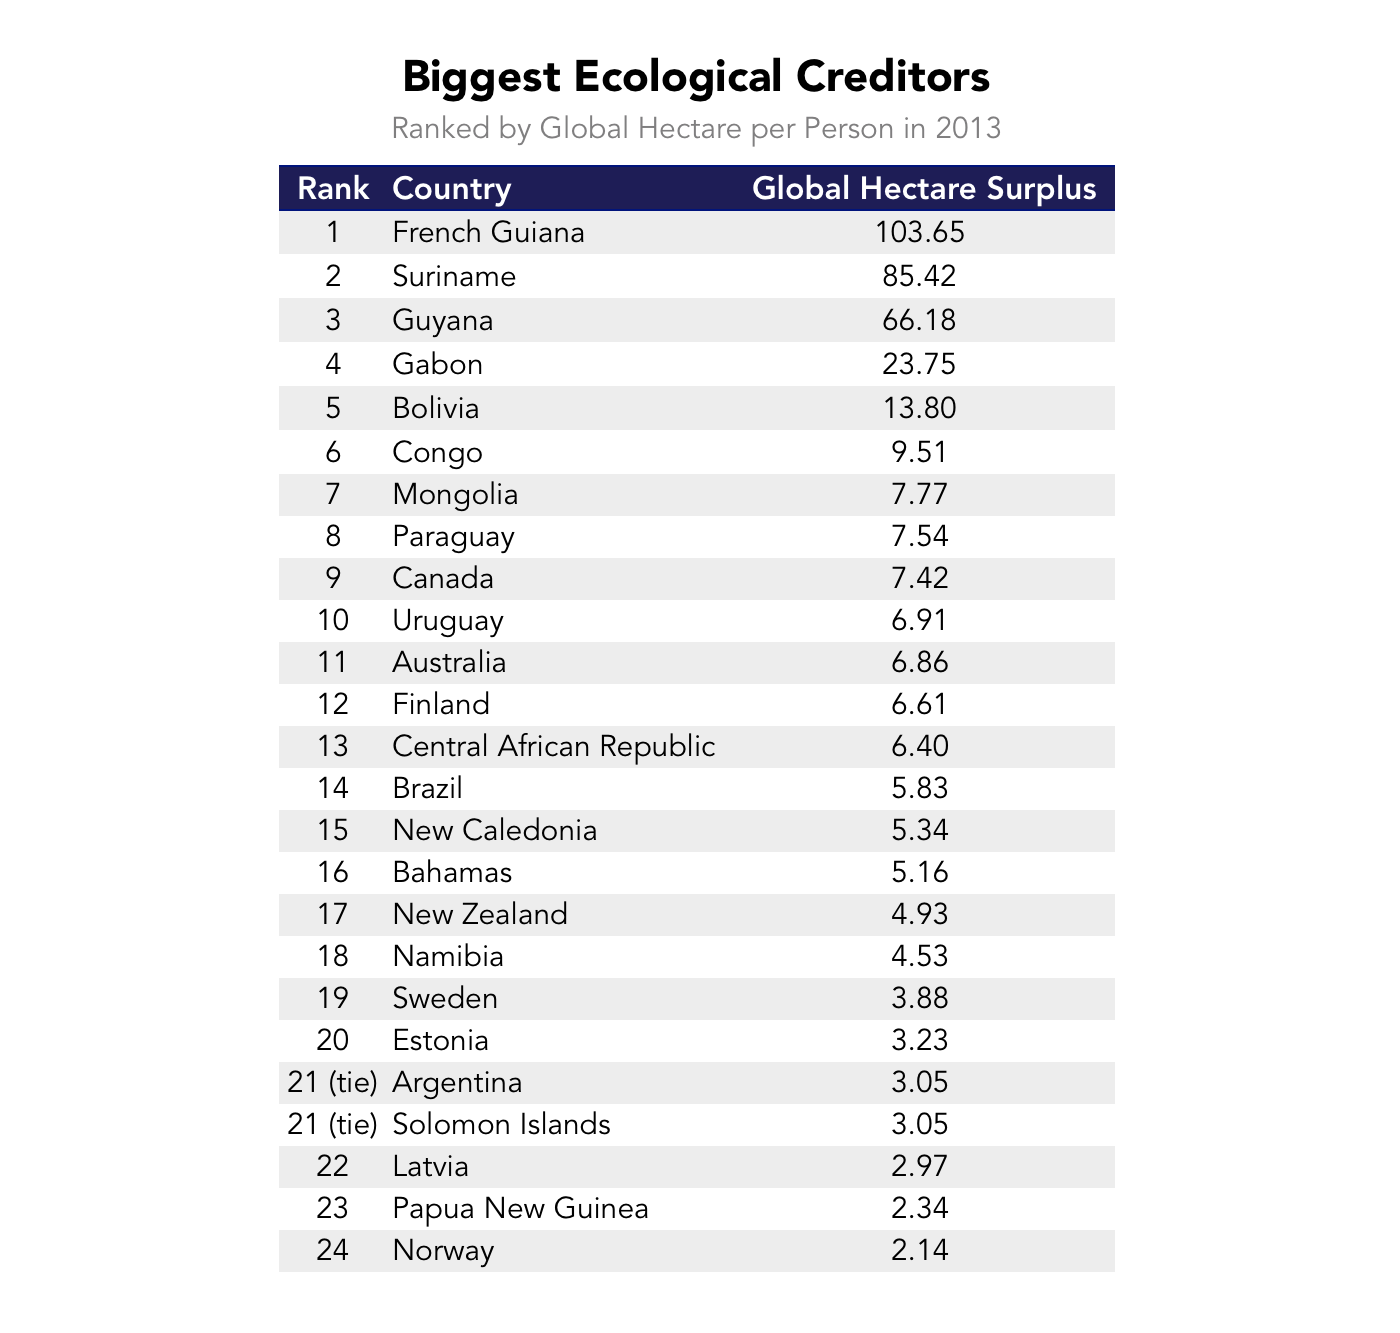
South American countries like French Guiana and Suriname contribute the most net biocapacity per person. Forests are highly productive in terms of natural resources. More than just the goods that come from forests, they consume and trap carbon. However, those countries are fairly small and consume a fraction of what the most resource-hungry countries consume.
Our next list features the other end of the spectrum, the biggest ecological debtors.
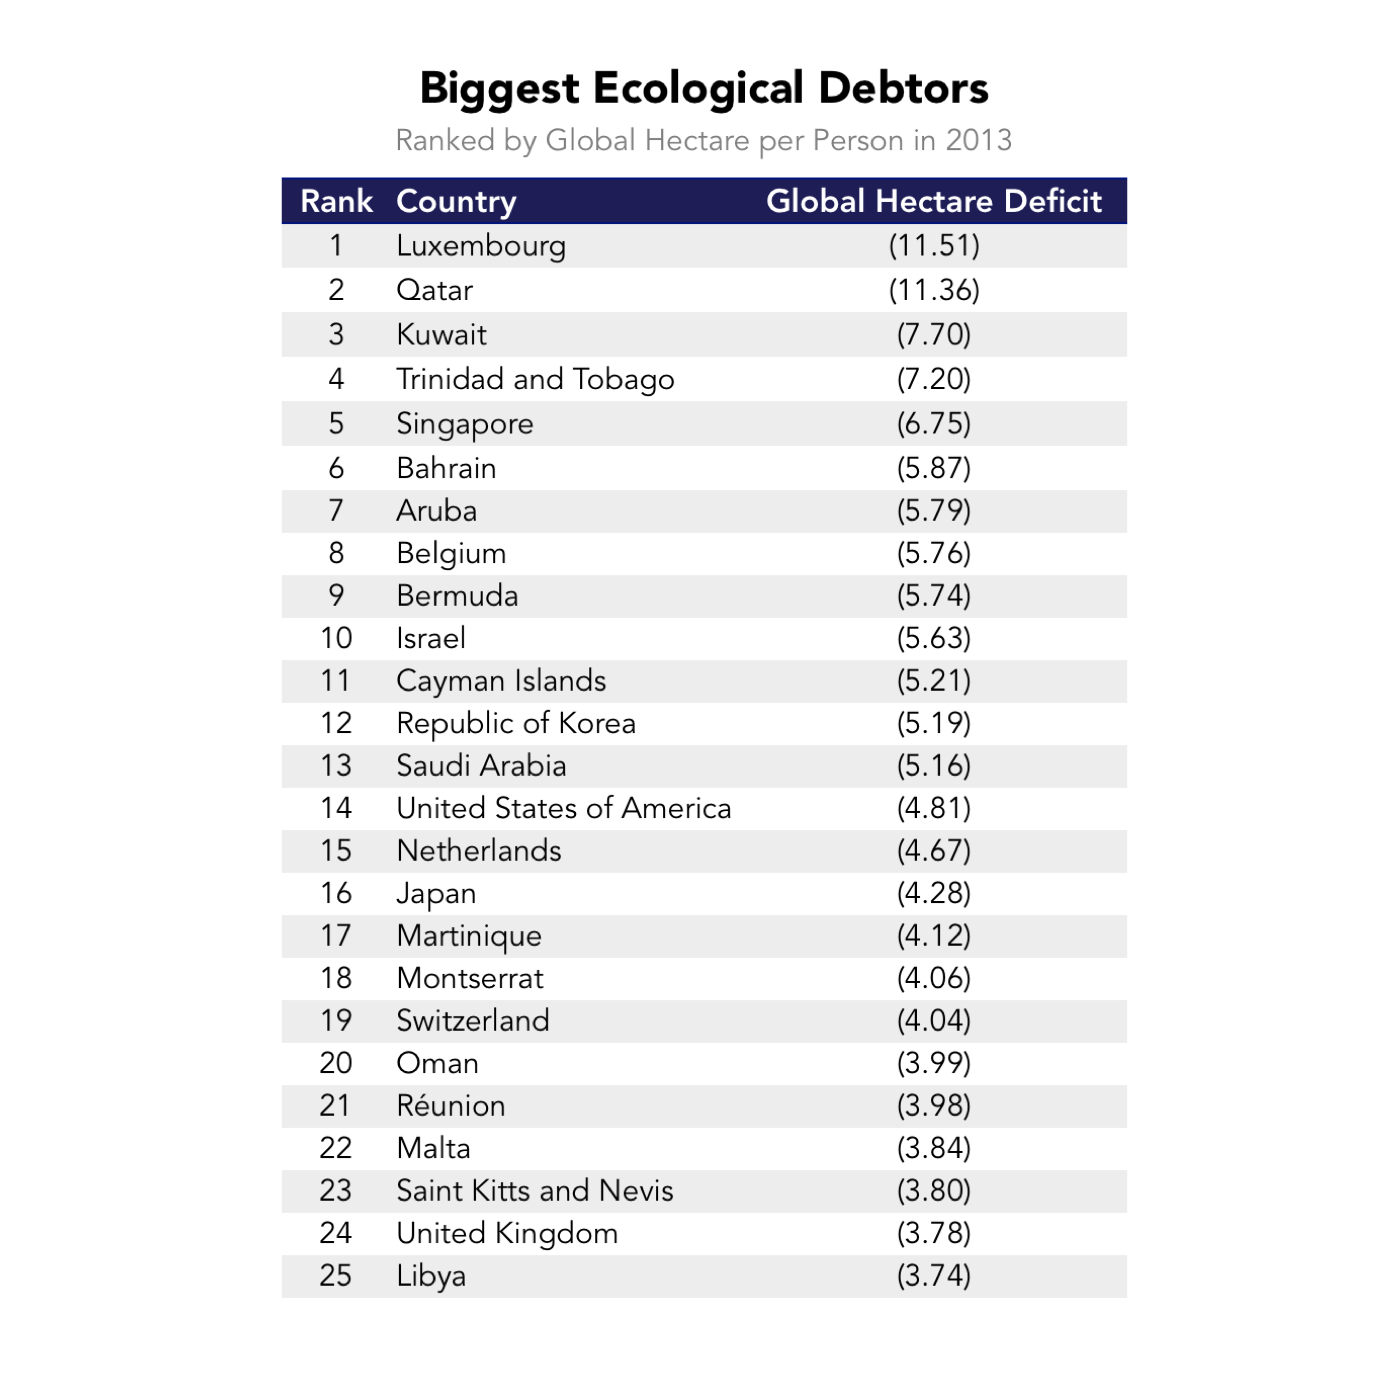
Luxembourg, a micronation neighboring Germany, ranks number one with an 11.51 global hectare per person deficit. Singapore, Belgium, South Korea, the Netherlands, Japan, Switzerland, Malta and the United Kingdom all place in the top 25 biggest ecological debtors. Oil producing countries such as Qatar, Kuwait, Bahrain, Saudi Arabia, Oman and Libya also rank highly.
We wondered if a country’s affluence was related to the amount of natural resources it could consume. Are the countries that don’t destroy the environment simply the ones who haven’t yet built up their economies?
We plotted the size of the ecological footprint against Gross Domestic Product (GDP) for each country. There’s a large amount of inequality in how GDP and ecological footprint are distributed, with the top few accounting for as much as all the rest combined. To keep those outliers at the top from distorting the picture, we performed a log transformation on both sets of numbers.
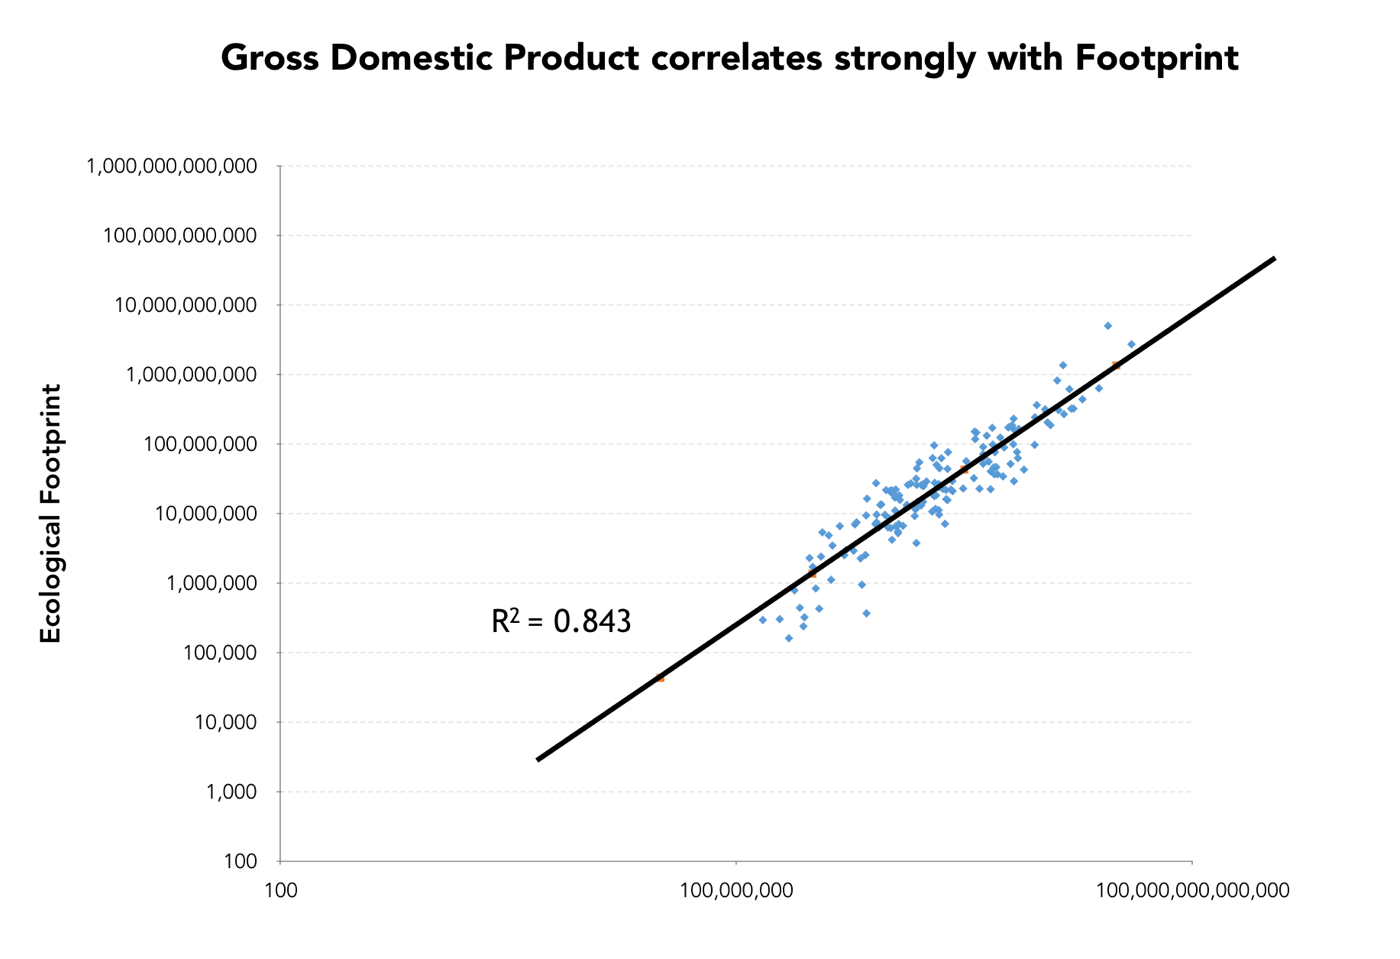
Countries that use the most resources typically have the highest GDP, while countries with low GDPs generally use the least resources. The correlation between the two is strong and positive — footprint increases as GDP increases. We fit a linear regression from GDP to footprint. It has an r-squared value of .843–GDP explains the vast majority of the variation in ecological footprint.
With GDP explaining so much of how much a country consumes, we wanted to see how the 50 largest economies performed. Positive numbers indicate an ecological surplus. People in those countries consume less than nature replenishes. Negative numbers show a deficit, where people consume more than their land can support.
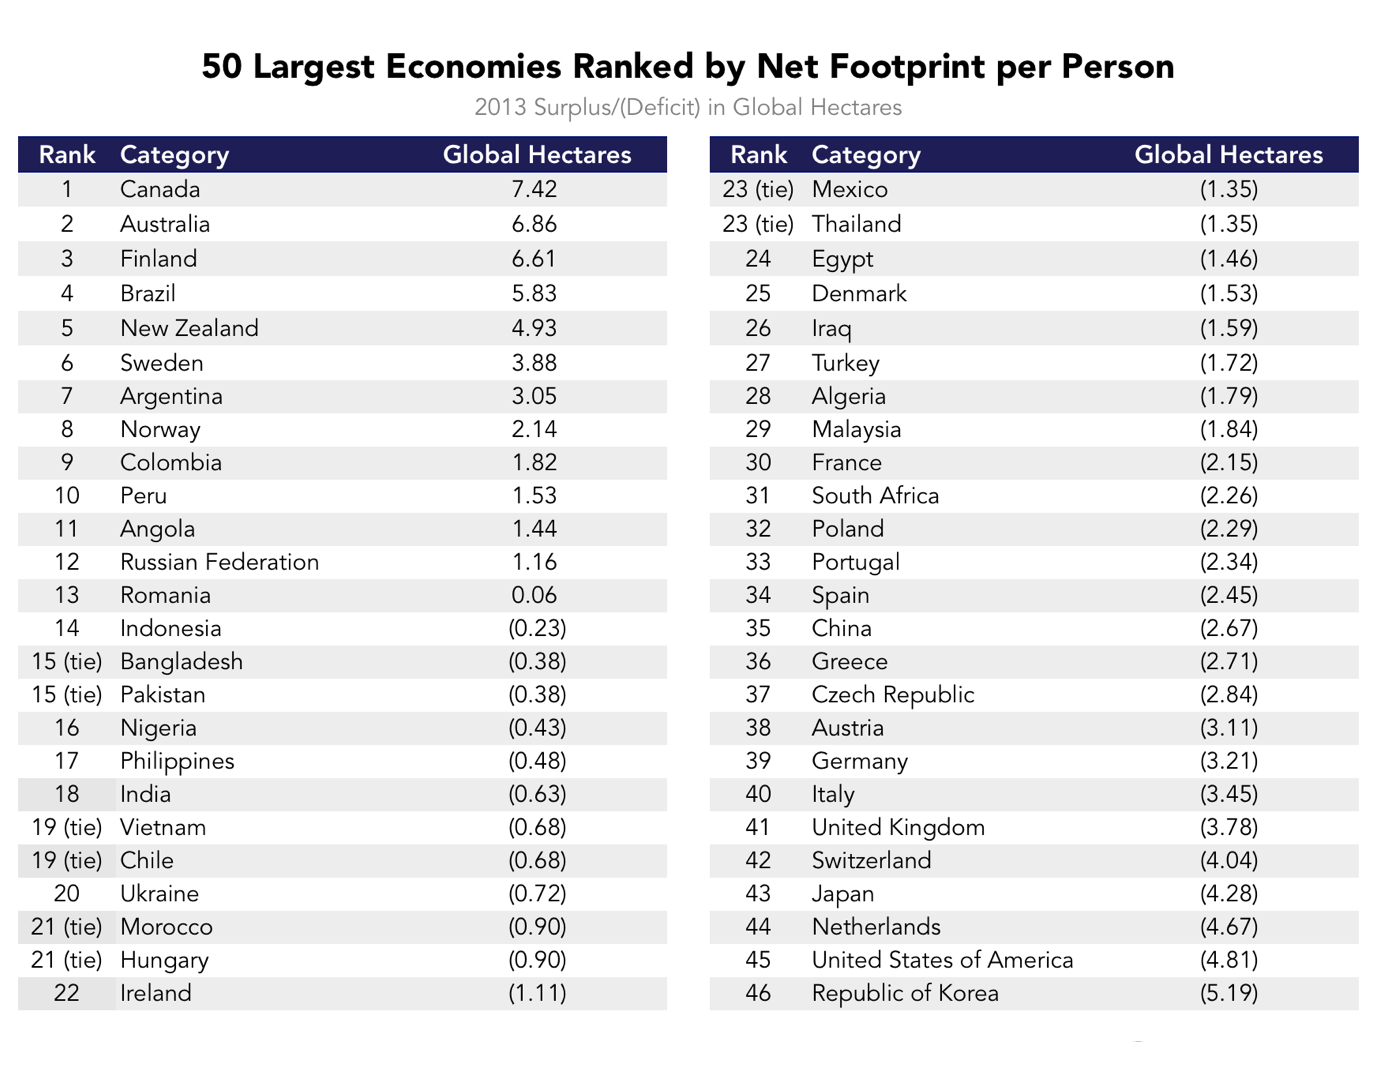
Canada is the most environmentally friendly major economy and tops the list with 7.42 global hectares per person of surplus. There are 13 countries from the 50 largest that produce surplus; the remainder take more than they put back. South Korea rounds out the bottom of the list with a 5.19 global hectares per person deficit. The United States has the second worst environmental track record by this measure.
Ecological footprint provides an accounting system for comparing the effect on our ecological account balance of many different types of human activity, such as weighing deforestation in the Amazon against the adoption of renewable energy sources in the United States. Bringing our global demand for biological resources back in line with what the earth can support has different implications for different countries.
As it turns out, having a large economy is a very good predictor you’ll be consuming more of the environment than you replace. As countries look to grow, the trend of environmental destruction will likely continue unless these countries take action to change course.

