Workers in the United States are in the midst of a punishing COVID-19 economic crisis. Unfortunately, while a new fiscal spending package and an effective vaccine can bring needed relief, a meaningful sustained economic recovery will require significant structural changes in the operation and orientation of the economy.
The unemployment problem
Many people blame government mandated closure orders for the decline in economic activity and spike in unemployment. But the evidence points to widespread concerns about the virus as the driving force. As Emily Badger and Alicia Parlapiano describe in a New York Times article, and as illustrated in the following graphic taken from the article:
In the weeks before states around the country issued lockdown orders this spring, Americans were already hunkering down. They were spending less, traveling less, dining out less. Small businesses were already cutting employment. Some were even closing shop.
People were behaving this way–effectively winding down the economy–before the government told them to. And that pattern, apparent in a range of data looking back over the past two months, suggests in the weeks ahead that official pronouncements will have limited power to open the economy back up.
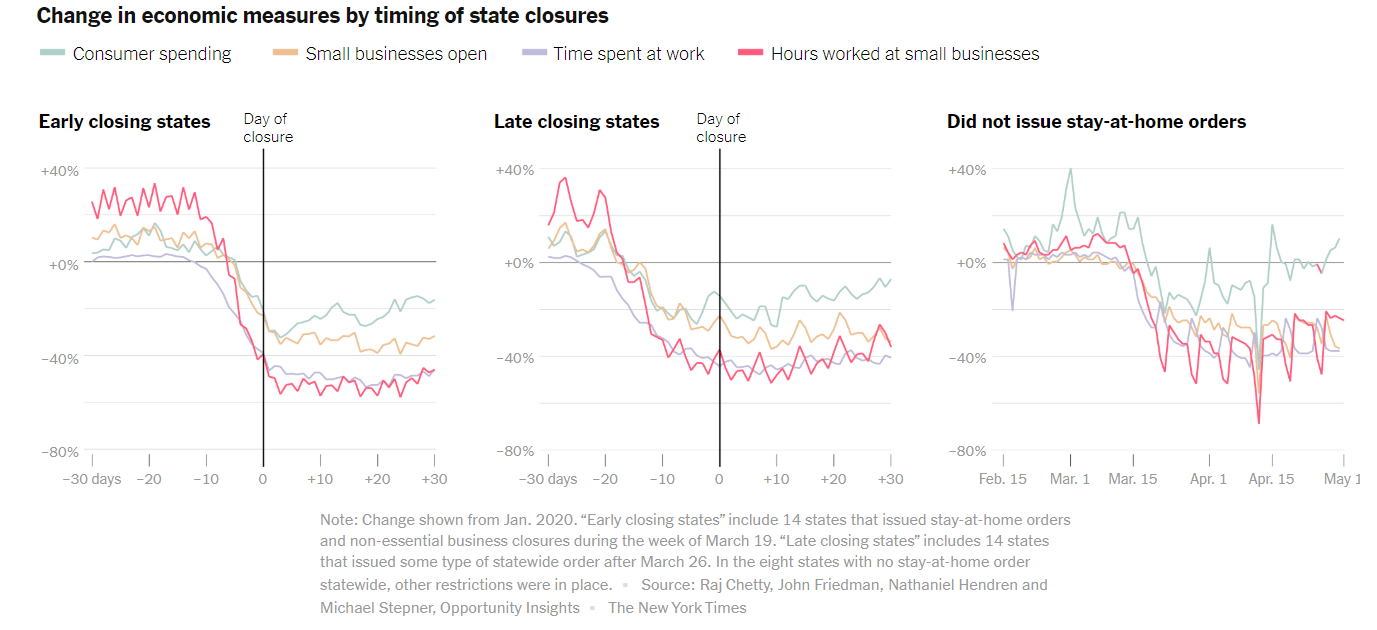
As the graphic shows, economic activity nosedived around the same time regardless of whether state governments were quick to mandate closings, slow to mandate closings, or unwilling to issue stay-at-home orders.
The resulting sharp decline in economic activity caused unemployment to soar. Almost 21 million jobs were lost in April at the peak of the crisis. The unemployment rate hit a high of 14.7 percent. By comparison the highest unemployment rate during the Great Recession was 10.6 percent in January 2010.
Employment recovered the next month, with an increase of 2.8 million jobs in May. In June, payrolls grew by an even greater number, 4.8 million. But things have dramatically slowed since. In July, only 1.8 million jobs came back. In August it was 1.5 million. And in September it was only 661,000. To this point, only half of the jobs lost have returned, and current trends are far from encouraging.
The unemployment rate fell to 7.9 percent in September, a significant decline from April. But a large reason for that decline is that millions of workers have given up working or looking for work and are no longer counted as being part of the labor force. And, as Alisha Haridasani Gupta writes in the New York Times:
A majority of those dropping out were women. Of the 1.1 million people ages 20 and over who left the work force (neither working nor looking for work) between August and September, over 800,000 were women, according to an analysis by the National Women’s Law Center. That figure includes 324,000 Latinas and 58,000 Black women. For comparison, 216,000 men left the job market in the same time period.
The relationship between the fall in the unemployment rate and worker exodus from the labor market is illustrated in the next figure which shows both the unemployment rate and the labor force participation rate (LFPR), which is measured by dividing the number of people 16 and over who are employed or seeking employment by the size of the civilian noninstitutional population that is 16 and over.
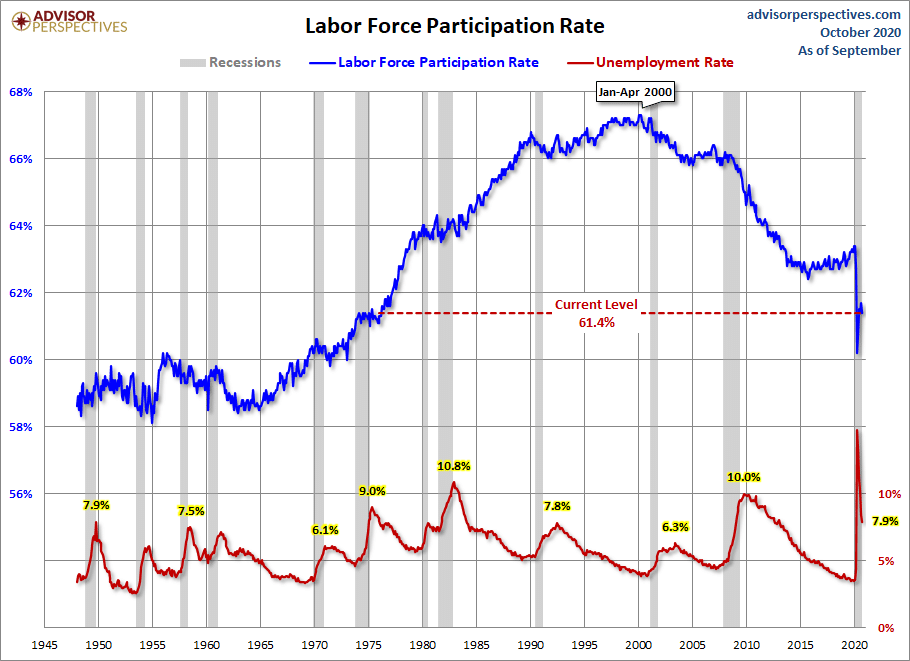
The figure allows us to see that even the relatively “low” September unemployment rate of 7.9 percent is still high by historical standards. It also allows us to see that its recent decline was aided by a decline in the LFPR to a level not seen since the mid-1970s. If those who left the labor market were to decide to once again seek employment, pushing the LFPR back up, unless the economic environment changed dramatically, the unemployment rate would also be pushed up to a much higher level.
Beyond the aggregate figures is the fact, as Heather Long, Andrew Van Dam, Alyssa Fowers and Leslie Shapiro explain in a Washington Post article, that “No other recession in modern history has so pummeled society’s most vulnerable.”
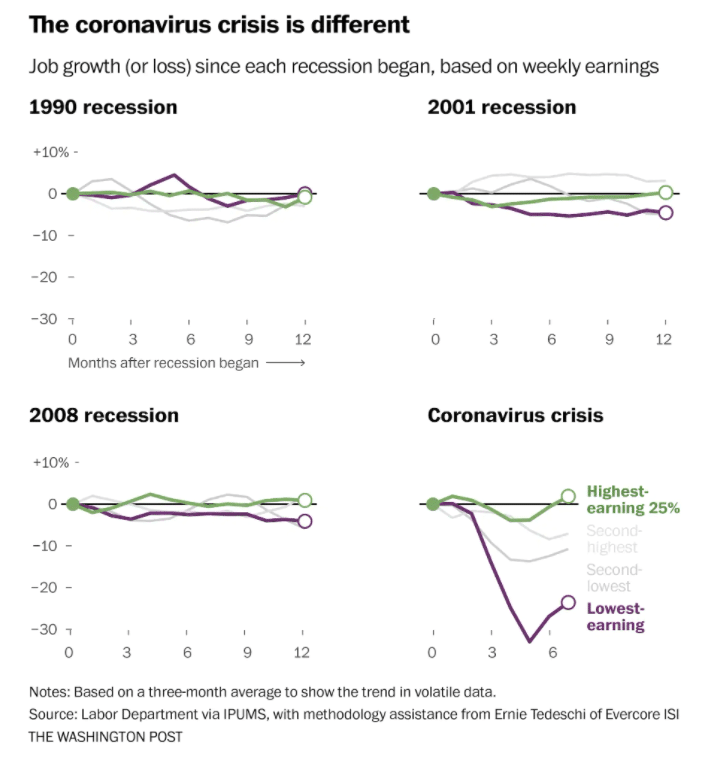
As we can see in the above graphic, the 1990 recession was a relatively egalitarian affair with all income groups suffering roughly a similar decline in employment. That changed during the recessions of 2001 and 2008, with the lowest earning cohort suffering the most. But, as the authors of the Washington Post article state, “even that inequality is a blip compared with what the coronavirus inflicted on low-wage workers this year.” By the end of the summer, the employment crisis was largely over for the highest earners, while employment was still down more than 20 percent for low-wage workers and around 10 percent for middle-wage workers.
Poverty is on the rise
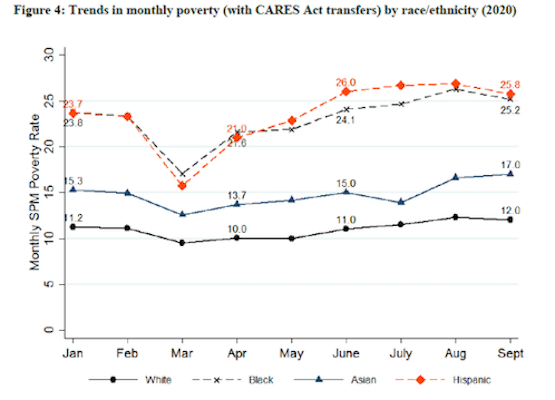
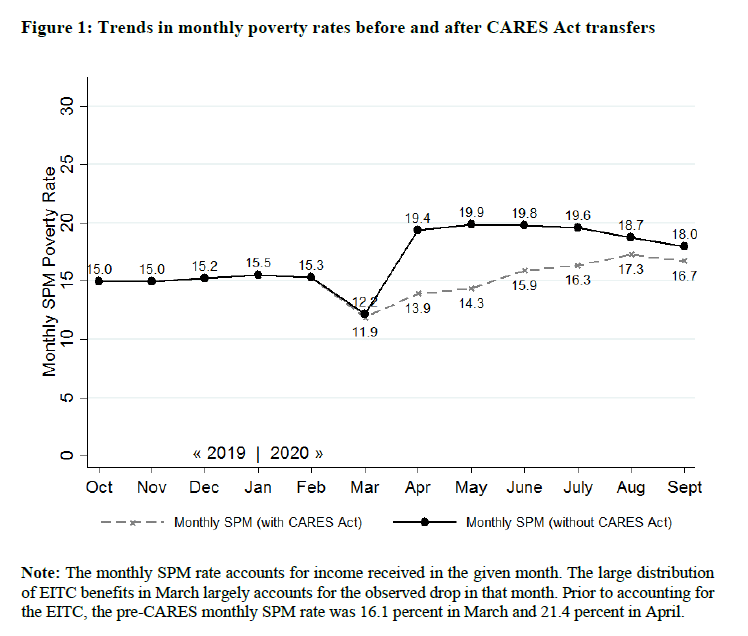
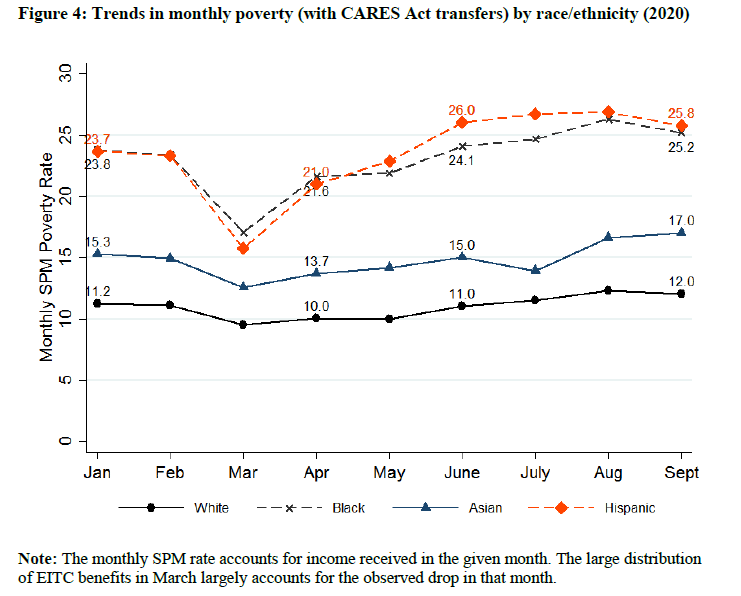
In line with this disproportionate hit suffered by low wage workers, the poverty rate has been climbing. Five Columbia University researchers, using a monthly version of the Supplemental Poverty Measure (SPM), provide estimates of the monthly poverty rate from October 2019 through September 2020. They found, as illustrated below, “that the monthly poverty rate increased from 15% to 16.7% from February to September 2020, even after taking the CARES Act’s income transfers into account. Increases in monthly poverty rates have been particularly acute for Black and Hispanic individuals, as well as for children.”
The standard poverty measure used by the federal government is an annual one, based on whether a family’s total annual income falls below a specified income level. It doesn’t allow for monthly calculations and is widely criticized for using an extremely low emergency food budget to set its poverty level. The SPM includes a more complete and accurate measure of family resources, a more expansive definition of family, the cost of a broader basket of necessities, and is adjusted for cost of living across metro areas.
As we can see in the above figure, the $2.2 trillion Coronavirus Aid, Relief, and Economic Security (CARES) Act, which was passed by Congress and signed into law on March 27th, 2020, has had a positive effect on poverty levels. For example, without it, the poverty rate would have jumped to 19.4 percent in April. “Put differently, the CARE Act’s income transfers directly lifted around 18 million individuals out of poverty in April.”
However, as we can also see, the positive effects of the CARES Act have gradually dissipated. The Economic Impact Payments (“Recovery Rebates”) were one-time payments. The $600 per week unemployment supplement expired at the end of July. Thus, the gap between the monthly SPM with and without the CARES Act has gradually narrowed. And, with job creation dramatically slowing, without a new federal stimulus measure it is likely we will not see much improvement in the poverty rate in the coming months. In fact, if working people continue to leave the labor market out of discouragement and the pressure of home responsibilities, there is a good chance the poverty rate will climb again.
It is also important to note that the rise in monthly rates of poverty, even with the CARES Act, differs greatly by race/ethnicity as illustrated in the following figure.
The need to do more
Republican opposition to a new stimulus ensures that that there will be no follow-up to the CARES Act before the upcoming election. Opponents claim that the federal government has already done enough and the economy is well on its way to recovery.
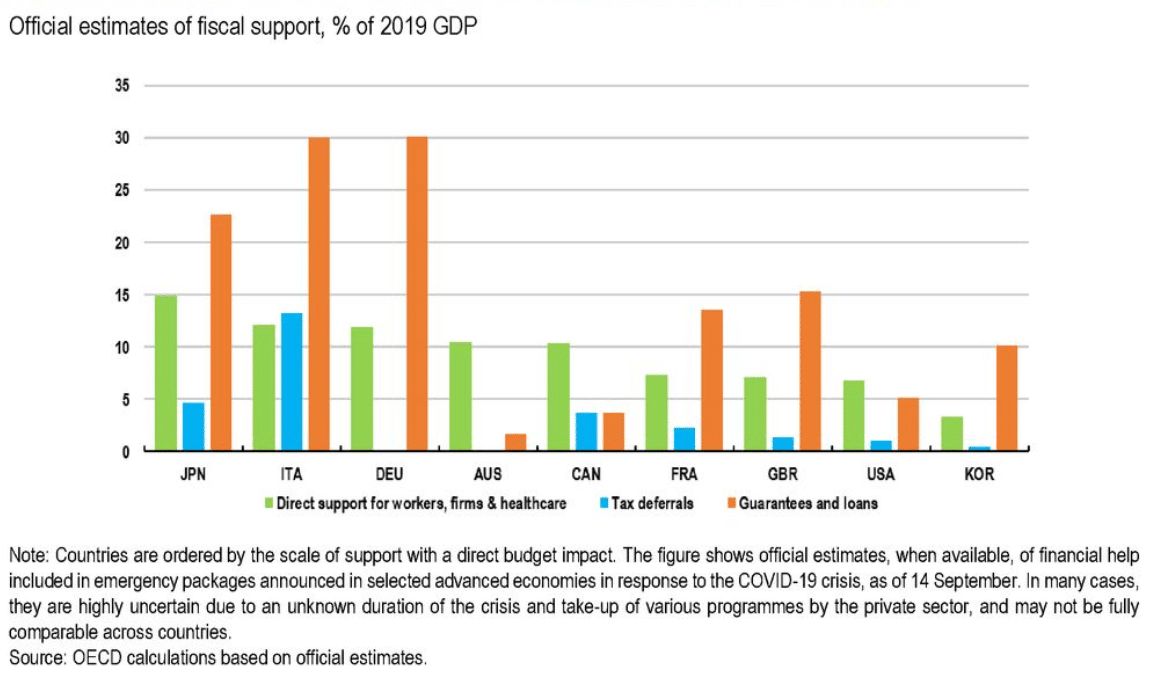
As for the size of the stimulus, the United States has been a lagger when it comes to its fiscal response to the pandemic. The OECD recently published an interim report titled “Coronavirus: Living with uncertainty.” One section of the report looks at fiscal support as a percent of 2019 GDP for nine countries. As the following figure shows, the United States trails every country but Korea when it comes to direct support for workers, firms, and health care.
A big change is needed
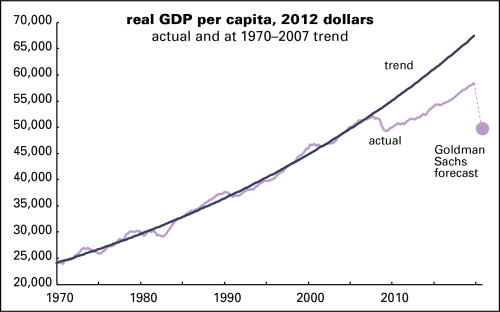
While it is natural to view COVID-19 as responsible for our current crisis, the truth is that our economic problems are more long-term. The U.S. economy has been steadily weakening for years. In the figure below, the “trend” line is based on the 2.1% average rate of growth in real per capita GDP from 1970 to 2007, the year before the Great Recession. Not surprising, real per capita GDP took a big hit during the Great Recession. But as we can also see, real per capita GDP has yet to return to its historical trend. In fact, the gap has grown larger despite the record long recovery that followed.
As Doug Henwood explains:
Since 2009, the growth rate has averaged 1.6%. Last year [2019], which Trump touted as the greatest economy ever, it managed to get back to the pre-2008 average of 2.1%, an average that includes two deep recessions (1973–1975 and 1981–1982).
At the end of 2019, actual [real GDP per capita] was 13% below trend. At the end of the 2008–2009 recession it was 9% below trend. Remarkably, despite a decade-long expansion, it fell further below trend in well over half the quarters since the Great Recession ended. The gap is now equal to $10,200 per person—a permanent loss of income, as economists say.
The pre-coronavirus period of expansion (June 2009 to February 2020), although the longest on record, was actually also one of the weakest. It was marked by slow growth, weak job creation, deteriorating job quality, declining investment, rising debt, declining life expectancy, and narrowing corporate profit margins. In other words, the economy was heading toward recession even before the start of state mandated lockdowns. The manufacturing sector actually spent much of 2019 in recession.
Thus, there is strong reason to believe that a meaningful sustained recovery from the current COVID-19 economic crisis is going to require more than the development of an effective vaccine and a responsive health care system to ensure its wide distribution. Also needed is significant structural change in the operation and orientation of the economy.

