Pretty much everyone accepts that inequality is a big problem in the U.S. But it is doubtful that most people truly grasp how successfully U.S. elites have captured the benefits of economic growth and, as a result, how much the resulting inequality has cost them. Here is one estimate of that cost—according to Carter C. Price and Kathryn A. Edwards, authors of a Rand Education and Labor study on income trends:
[the] aggregate income for the population below the 90th percentile . . . would have been $2.5 trillion (67 percent) higher in 2018 had income growth since 1975 remained as equitable as it was in the first two post-War decades. From 1975 to 2018, the difference between the aggregate taxable income for those below the 90th percentile and the equitable growth counterfactual totals $47 trillion.
That $2.5 trillion was enough to give each and every worker in the bottom nine income deciles an additional $1144 a month, every month of the year. That is life changing money for tens of millions—and that is only a partial measure of the costs of inequality.
Economic restructuring
The growth in inequality over the last four decades owes much to the implementation of several interlocking and mutually reinforcing economic policies, all largely supported by both Democratic and Republic administrations. These policies, by furthering the globalization, financialization, deregulation, and privatization of U.S. economic activity, greatly strengthened corporate profitability and power at the expense of working people, thereby ensuring that the benefits of growth would increasingly flow into ever fewer hands.
In fact, according to the economist Emmanuel Saez, the top 1 percent captured:
- 45 percent of the country’s total real family income growth during the Clinton era economic expansion years of 1993 to 2000
- 65 percent of the country’s total real family income growth during the Bush era economic expansion years of 2002 to 2007
- 95 percent of the country’s total real family income growth during the Obama era economic recovery years of 2009 to 2012
Over the entire period, 1993 to 2012, a period which includes two recessions, the top 1 percent captured 68 percent of the country’s total real family income growth. Workers suffer from recessions—job losses, wage cuts, insecurity. And increasingly expansions bring them few benefits, with most of the gains going only to the very richest.
Estimating the dollar costs of inequality
In the Rand study referenced above, Price and Edwards set out to quantify the dollar costs of inequality. Although their estimation techniques are complex, their methodology is straightforward. In brief, they found that over the period 1947 to 1974, all major income groups tended to enjoy similar rates of income growth that closely followed the rate of growth of the overall economy, as measured by the growth in per capita GDP. This changed dramatically over the period 1975 to 2018. In this period, income growth for most earners, although not for those at the top of the income distribution, was significantly below the rate of growth of the economy. As a consequence, Price and Edwards focused their work on the years 1975 to 2018.
They began their quantification of the dollar costs of inequality by estimating the earnings growth of different income groups and the rate of growth in per capita GDP over the period’s five business cycles. They then estimated the earnings growth of the same groups under the assumption that the incomes of all groups grew at the same rate as the economy, much as occurred over the 1948-1974 period. The dollar cost of inequality for each income group was then calculated as the difference between the resulting counterfactual 2018 income and the actual 2018 income.
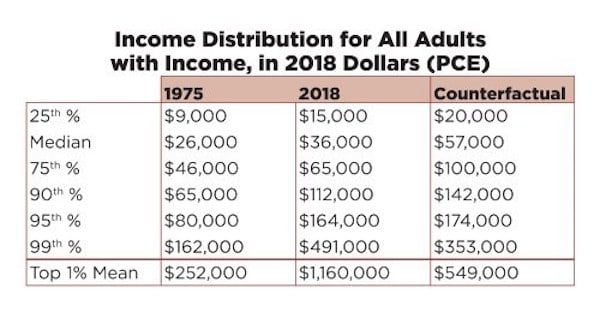
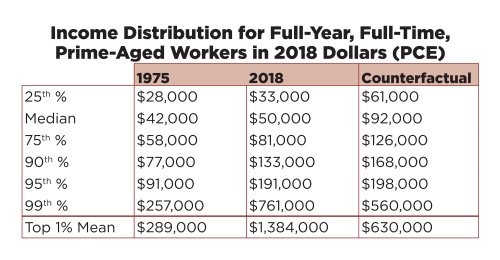
Their most important results are highlighted in the two tables below. In both tables, adults are defined as those at or above the age of 20 with nonzero income, and income figures for 1975 are expressed in 2018 dollars, having been adjusted using the Personal Consumption Expenditures Price Index (PCE).
As we can see in the table above, at every income level up to the 99th percentile, the counterfactual income was greater than the realized income. In other words, workers received less than what they would have earned had inequality not grown, although the difference is not significant for those in the 95th percentile.
The median worker, whose real income rose by $10,000–from $26,000 to $36,000–would have earned significantly more, $57,000, if inequality had not worsened. That lost $21,000 would have more than doubled their earnings over the period. Moreover, this approach to measuring inequality likely understates its cost, since “much of the movement at the bottom of the distribution is driven by an increase in hours not an increase in wages.”
Those at the top of the income pyramid were, of course, the beneficiaries of this growth in inequality. As Price and Edwards point out:
the threshold for the 99th percentile . . . grew from $162,000 to $491,000, well over the counterfactual of $353,000. . . . Further, due to significant increases in the dispersion of incomes within the 99th percentile, the average income growth for the top one percent was substantially higher, at more than 300 percent of the real per capita GDP rate.
The next table considers the cost of inequality for full-year, full-time, prime-aged workers (25 to 54). Perhaps most striking is the fact that “the majority of full-time workers did not share in the economic growth of the last forty years.” The median full-year, full-time, prime-aged worker experienced a real income gain of only $8000 over the years 1975 to 2018; the growth of inequality cost them an additional $42,000.
While the median income grew by less than 20 percent of the growth in per capita GDP, the threshold to enter the top one percent grew by 166 percent of the per capita GDP and the growth rate of the average income within the top one percent was again over 300 percent of per capita GDP growth.
Ecological concerns aside, this study makes clear that growth, because of the nature and structure of the U.S. economy, largely benefits only the very wealthy. Moreover, the study’s results do not capture the full costs of inequality. For example, as Price and Edwards recognize, using the 1975 income distribution as a starting point means that the inequalities in income that existed then, especially those related to race and gender, were built into the calculations, thereby leading to a dramatic understatement of the costs of inequality for most workers of color and women. Then, there is also the lack of health, solidarity, security, and confidence that often comes from low and stagnant earnings in a rich country.
As one might expect, those at the top of the income pyramid have little interest in acknowledging the extent or costs of inequality, and even less in calling attention to the processes and policies that sustain it. Needed change will only come from organizing that helps to expose the maldistribution of power and rewards in our existing economy and encourages the kinds of workplace and community actions that can bring to light alternative possibilities.


