The consumer price index fell again in May — 0.2 percent — as energy prices fell for the fourth consecutive month. The overall index has now fallen at a 0.7 percent annualized rate since February. The core CPI rose 0.1 percent in the month and at a 0.1 percent annualized rate over the last three.
The fall in consumer prices was broadly based, as most major categories were flat or falling in the month. Food prices remained flat in May, but outside the core, the recent fall in energy prices contributed more heavily to the overall deflation. Energy prices fell 2.9 percent in the month — a 16.2 percent annualized rate over the last three months and 2.8 percent over the last six.
Rent and owners’ equivalent rent of primary residences remained essentially flat in May. Over the last three months, rent of primary residences has risen at a 0.3 percent annualized rate, while the larger owners’ equivalent rent component of the CPI has fallen at a 0.4 percent rate. Falling home fuel prices helped balance out a 2.5 percent rise in the price of lodging away from home, leaving the overall price of housing flat.
Transportation prices fell 1.2 percent in May — again in large part due to a 5.0 percent fall in the price of motor fuel. Outside of fuel prices, however, the story is more mixed. New car prices have grown at a 0.9 percent annualized rate over the last three months, but the price of used cars and trucks still rose 0.6 percent in May. The trend in used vehicles is continuing disinflation as the last three months have seen 5.0 percent inflation compared to 18.8 over the previous three months.
Elsewhere, the recreation component of the CPI was flat in the month, while communication prices fell 0.2 percent. The price of medical care rose 0.1 percent in the month and has been growing at a 3.7 percent rate over the last six months. For May, inflation in medical care was driven largely by increases in the cost of hospital services, which rose 0.4 percent.
The 8.0 percent rate of inflation in the price of hospital services over the last six months has outpaced the cost of medical care generally, which has grown at a 3.7 percent annualized rate over the same period. This appears to be the result of state and local budget pressures — which, given the fall in tax revenues over the last two years, is unsurprising. The 5.4 percent rate of inflation in education and 7.1 percent inflation in water, sewer, and trash collection services provide additional evidence that state and local revenue requirements are one of the major sources of inflation overall.
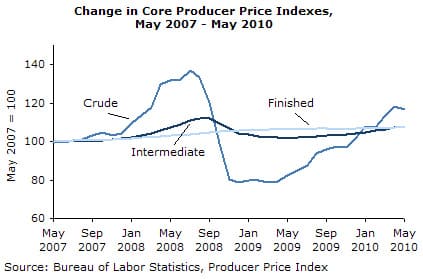
The price index for core crude goods fell 0.2 percent in May, but has risen at a 39 percent annualized rate over the last three months. Much of 2008 saw a boom and even larger bust in the price of core crude goods. The price of core crude goods is recovering from this apparent overshoot, but early-stage goods do not account for the entire cost of production at later stages — which have not seen the same volatility over the past 36 months.
The same story is visible in the import data, where imports of non-fuel industrial supplies have shown the same boom and bust pattern as core crude goods while the price of non-automotive consumer goods have not responded as strongly. Over the last three months, the rate of inflation in these consumer imports has risen at a 1.2 percent annualized rate. The price of non-fuel industrial supply imports has risen at a 25 percent annualized rate over the last three months, but was still 5.3 percent below its mid-2008 peak.
Overall, deflation continues to be the order of the day. To the extent that this has raised the real hourly earnings of workers — now close to their pre-recession peak — this may be good news for those employed. The rebound in non-energy commodity prices and governmental budgetary concerns remain the primary sources of increasing prices. So long as unemployment remains high and there remains an oversupply of housing, there is little risk of inflation.
David Rosnick is an economist at the Center for Economic and Policy Research in Washington, DC. This article was first published by CEPR on 17 June 17 2010 under a Creative Commons license.
| Print

