Over the summer there has been a hot debate about Social Security and the federal budget, especially in relation to the National Commission on Fiscal Responsibility and Reform. It is reasonable to expect that the major players in this debate will do their homework about the issues under consideration. In order to help them in this process, here is a quick list of study questions on Social Security and the federal budget. Reporters and editors at major news outlets may also want to review these questions, since it seems that they could also use some additional background knowledge on these topics.
The Questions
1) How much higher are real wages projected to be in 2040 than today? In other words, how much richer do we expect the average worker to be 30 years from now?
2) How did the 2010 Social Security Trustees Report change the projections for 2040 wages compared with the 2009 report?
3) If we solve the projected shortfall in Social Security entirely by raising the payroll tax, what percent of the gain in real wages over the next 30 years would have to go to pay the tax?
4) What percent of real wage gains over the last 30 years was absorbed by the increase in Social Security payroll taxes?
5) What percent of the projected long-term budget shortfall is due to the inefficiencies of the U.S. health care system?
6) How much wealth should we expect near retirees to have to support themselves in retirement?
7) What percent of older workers have jobs in which they can reasonably be expected to work into their late 60s?
Certainly anyone on the deficit commission should be able to answer these questions, as should any of the people reporting on Social Security or deficits in the media. But for those readers who do not fit these descriptions, here are the answers.
The Answers
1) According to the 2010 Social Security Trustees Report, the average real (adjusted for inflation) wage is projected to be 48.7 percent higher in 2040 than it is today (see Figure 1). In other words, if our kids work 30 hour weeks on average, they would take home about 10 percent more than we do today working 40 hour weeks. Deficit hawks have been known to quip about how our children and grandchildren will be living in chicken coops, but they’re just kidding, right?
FIGURE 1: Projected Real Annual Wages from 2010 Social Security Trustees Report, 2010-2040 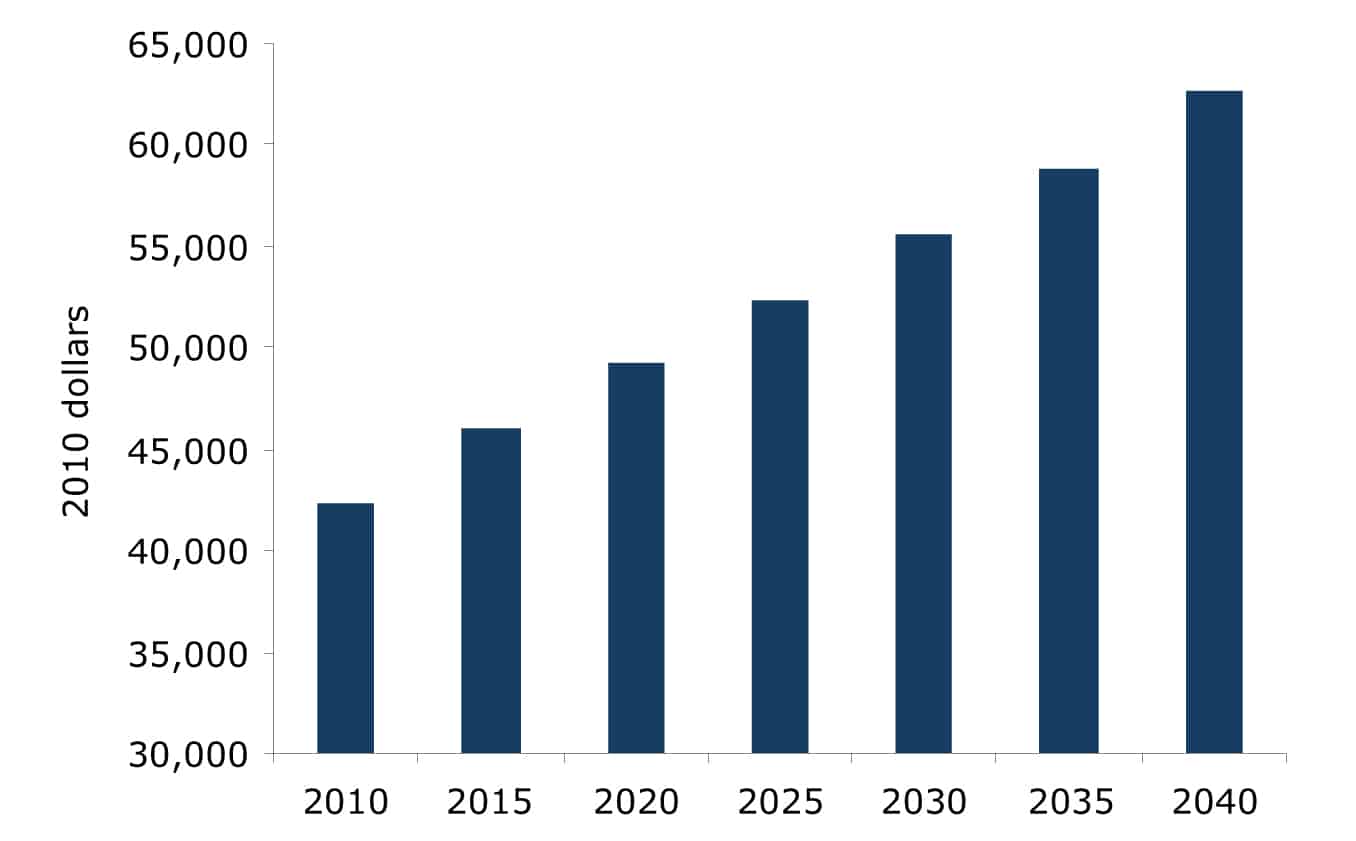
Source: Author’s analysis of 2010 OASDI Trustees Report; career-average level of earnings for median workers.
As a practical matter, most workers have not seen much by the way of wage gains over the last three decades because such a large portion of wage growth has gone to those at the top: people like many wealthy policymakers. This upward redistribution of income of this period, and the possibility that it could continue, is the reason that most people who are concerned about the well-being of future generations focus on the distribution of income. The impact of any potential increases in Social Security taxes on the typical worker’s income is trivial compared to the impact of a continued upward redistribution of income.
2) The 2010 Trustees Report had good news on the wage front. It assumed that health care reform would slow the rate of growth of employer provided health care benefits. This means that wages are now projected to grow more rapidly since less money will be diverted to cover rising health care costs. In 2009 the Trustees projected that the average wages would only rise by 37.2 percent between 2010 and 2040 (see Figure 2).
This means that the changes between the 2009 and 2010 Trustees Reports imply that wages will be nearly 10 percent higher in 2040 than we previously believed. Everyone saw or heard the lead item in the Washington Post and on National Public Radio: “New Trustees Report Shows Our Children Will Be Much Richer.” Okay, maybe they managed to overlook this part of the story, but those who are making decisions about the federal budget should know it.
FIGURE 2: Projected Real Annual Wages from 2009 and 2010 Social Security Trustees Reports, 2010-2040 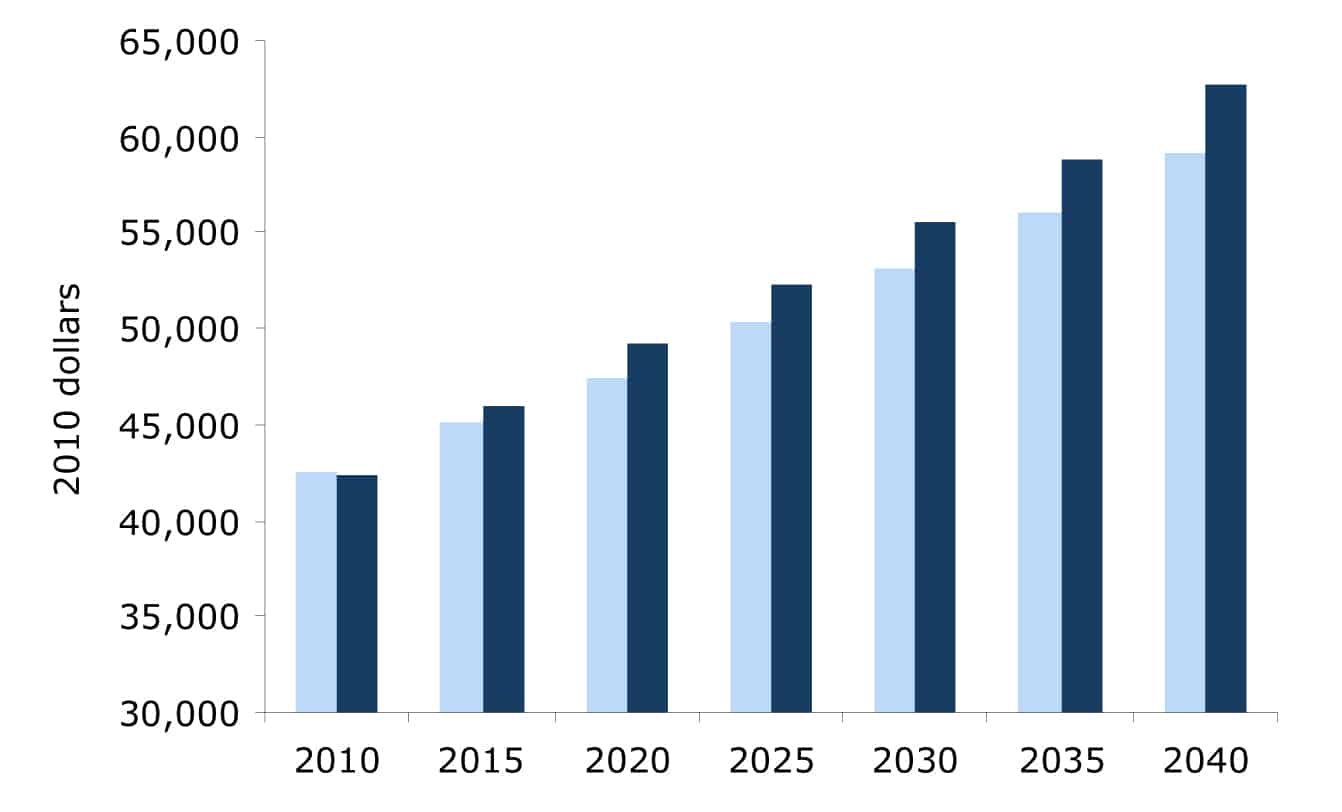
Source: Author’s analysis of 2009 and 2010 OASDI Trustees Reports; career-average level of earnings for median workers.
3) Number 3 is somewhat of trick question, since it depends on exactly the formula we use. The Trustees Report tells us that if we raise the tax tomorrow by 0.96 percentage points on both the employee and employer (1.92 percent in total), then the program will be fully solvent through its 75-year projection period. If we went this route, then it would mean that the tax increase would take up 5.9 percent of the projected wage growth over the next three decades.
But, we may not want to impose a tax increase like this tomorrow. There is a huge amount of uncertainty about these projections, and the program faces no imminent shortfall. Suppose we raised both side of the payroll tax by 0.07 percentage points annually beginning in 2020 and continuing at least to 2040. Then by 2040, the rate would have risen by 1.47 percentage points on both the worker and employer. This would take up 12.0 percent of the projected wage growth over this period, leaving our children on an after-tax basis just 42.8 percent richer than we are. This doesn’t quite sound like the story about our kids living in chicken coops (see Figure 3).
FIGURE 3: Projected Wage Growth Vs. Tax Increases, 2010-2040 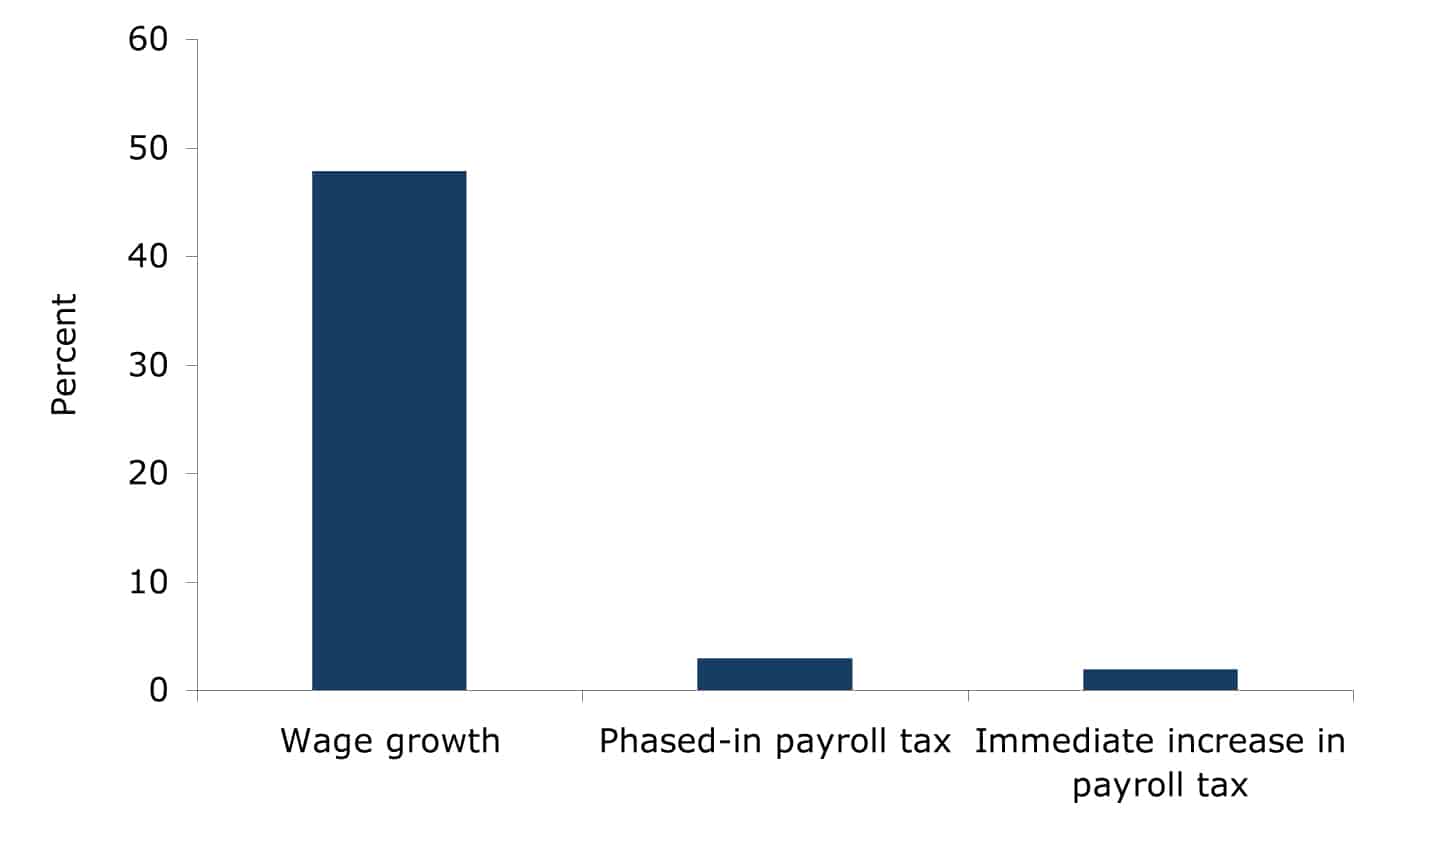
Source: 2010 OASDI Trustees Report and author’s analysis.
4) The Social Security tax increases of the last 30 years took 6.8 percent of average wage growth. This is in the same range as the portion of projected future wage growth that may have to go to higher Social Security taxes. The big problem in the story is that people have been living longer through time. If we want to enjoy a growing portion of our lives in retirement, then it will cost somewhat more money. This means that after-tax wages will grow less rapidly than would otherwise be the case.
It is worth noting that the gains in life expectancy also have not been distributed evenly. Most of the gains went to those in the top two quintiles of the income distribution.
5) The United States has by far the most inefficient health care system on the planet. We pay more than twice as much per person as people in other wealthy countries with very little to show for it in terms of health outcomes. If we had the same per person health care costs as any other country in the world the long-term budget projections would show huge surpluses rather than deficit (see Figure 4).
FIGURE 4: Projected Budget Deficit Under Alternate Health Care Cost Scenarios 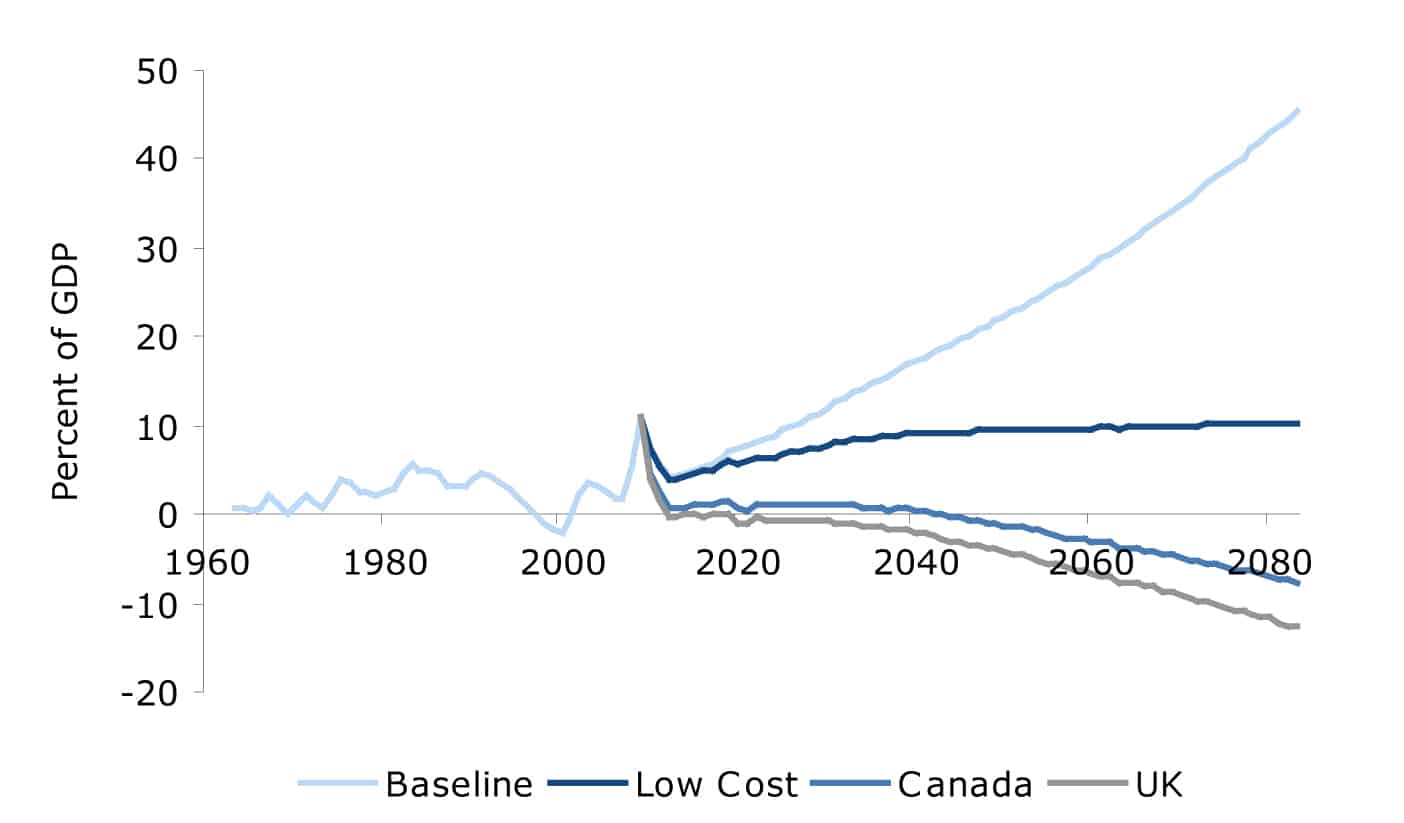
Source: Congressional Budget Office, The Long-Term Budget Outlook, June 2009 and World Bank, World Development Indicators; See www.cepr.net/calculators/hc/hc-calculator.html to compare other scenarios.
6) Critics of Social Security have held up the image of affluent elderly getting Social Security checks. They talk of seniors driving up to their gated communities in their Lexuses. While this may describe such critics’ peers, it is not an accurate description of the vast majority of seniors, most of whom rely on Social Security for the majority of their income.
This is likely to be even more true of the baby boom generation that is at the edge of retirement. Few have traditional defined benefit pensions. They have seen much of the wealth they were able to accumulate destroyed by the collapse of the housing bubble and the subsequent plunge in the stock market (see Figure 5 and Figure 6).1
FIGURE 5: Net Worth of Households Aged 45-54 in 2004 and 2009, by Income Quintile 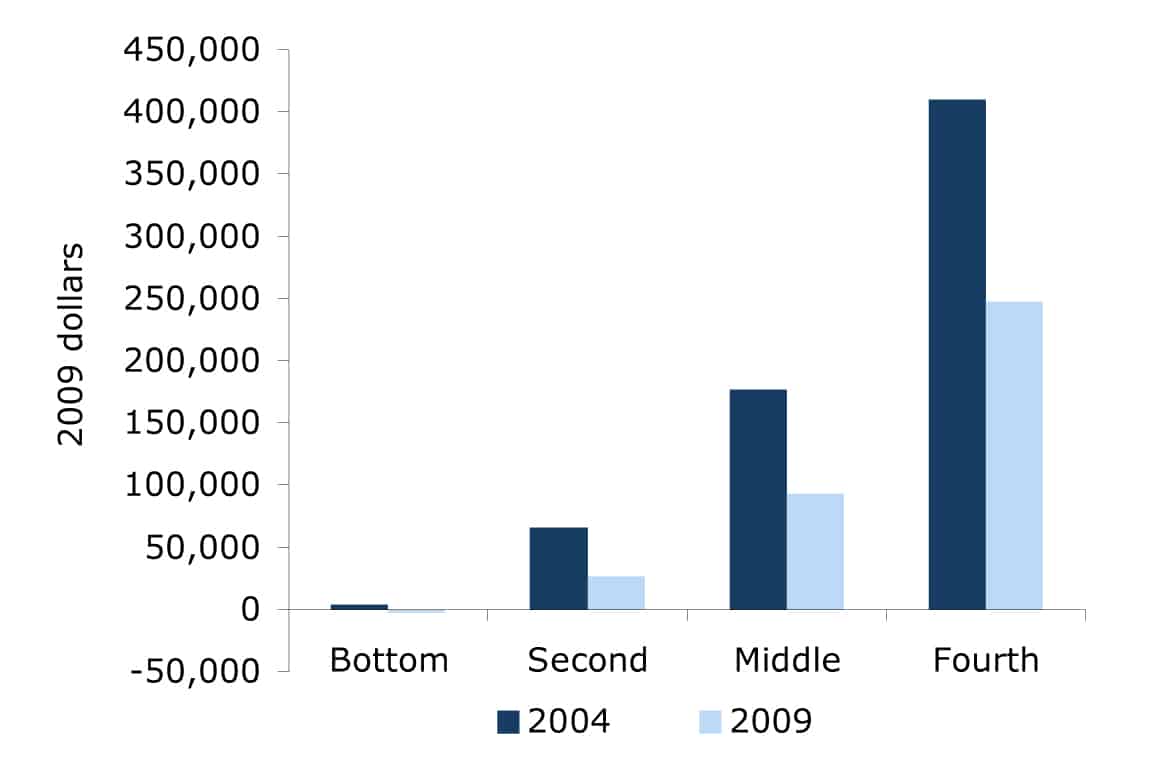
Source: Author’s analysis of 2004 Federal Reserve Board Survey of Consumer Finance. Top quintile figures excluded: $2.5M in 2004 and $1.6M in 2009.
FIGURE 6: Net Worth of Households Aged 55-64 in 2004 and 2009, by Income Quintile 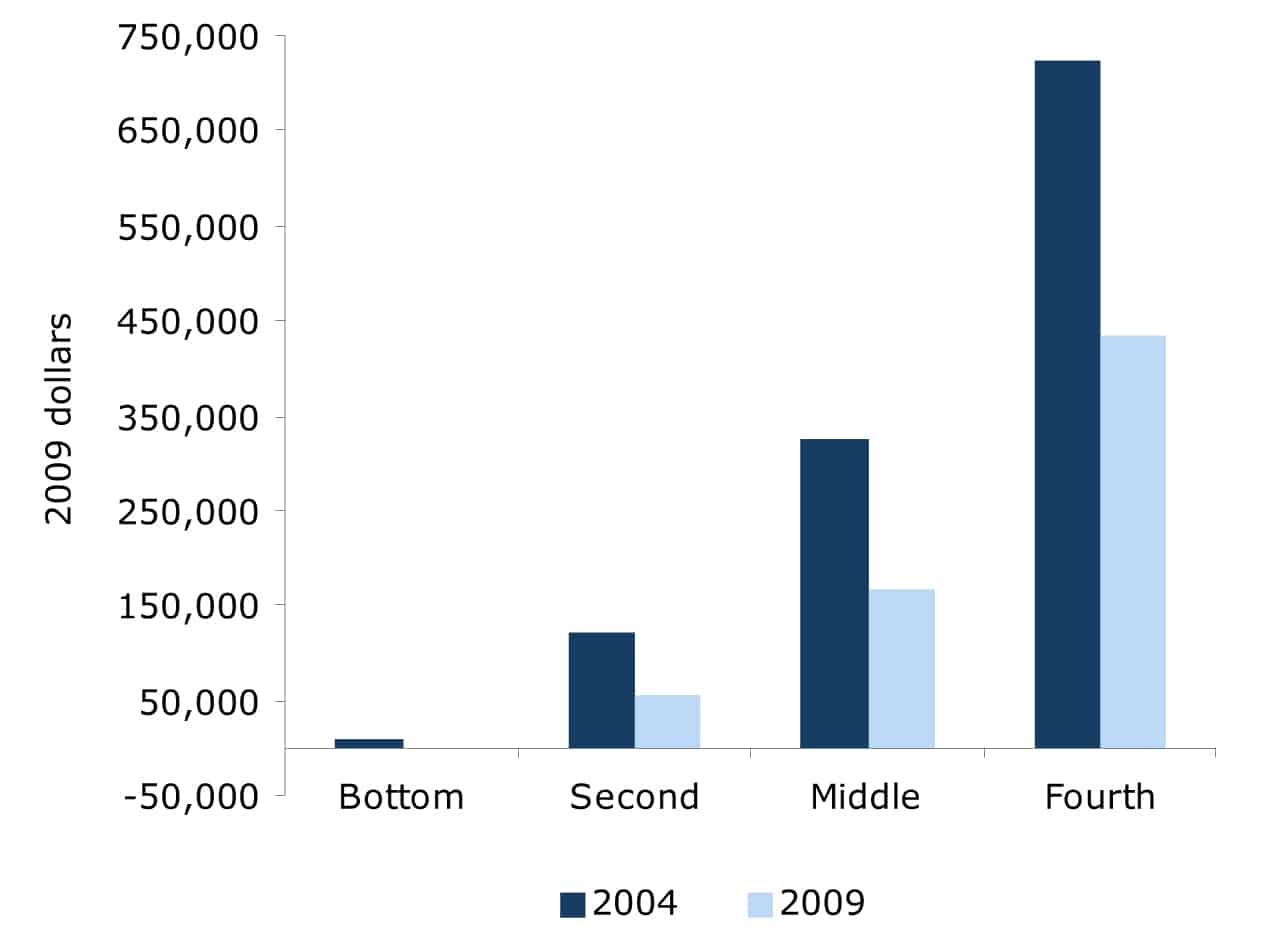
Source: Author’s analysis of 2004 Federal Reserve Board Survey of Consumer Finance. Top quintile figures excluded: $3.8M in 2004 and $2.7M in 2009.
7) Many policymakers are able to still work into their late 70s. This leads many deficit hawk types to think all workers should be expected to work until age 70 or even older.
However, this is not likely to be as easy for most workers as it is for them. Forty five percent of workers over age 58 work at jobs that are physically demanding or have difficult work conditions.2
So there you have it: seven key facts about Social Security, the budget and the well-being of workers and retirees. Policymakers and members of the media who influence the debate about these issues should know this information inside out.
1 For additional details, see Baker, Dean and David Rosnick. 2009. “The Wealth of the Baby Boomer Cohorts After the Collapse of the Housing Bubble.” Washington, DC: Center for Economic and Policy Research. Available at www.cepr.net/documents/publications/baby-boomer-wealth-2009-02.pdf.
2 Rho, Hye Jin. 2010. “Patterns in Physically Demanding Labor Among Older Workers.” Washington, DC: Center for Economic and Policy Research. Available at www.cepr.net/documents/publications/older-workers-2010-08.pdf.
Dean Baker is an economist and Co-Director of the Center for Economic and Policy Research in Washington, D.C. This article was published by CEPR in September 2010 under a Creative Commons license.
| Print
