Social Security has made it possible for the vast majority of workers to enjoy a period of retirement in at least modest comfort without relying on their children for support. The average length of retirement has increased consistently since the program was started in 1937. However, the increase in the normal retirement age from 65 to 67 that is being phased in over the years 2003 to 2022 largely offsets the increase in life expectancy.1 As a result, workers who work long enough to collect their full benefits will see little gain in the expected length of their retirement over this period.2
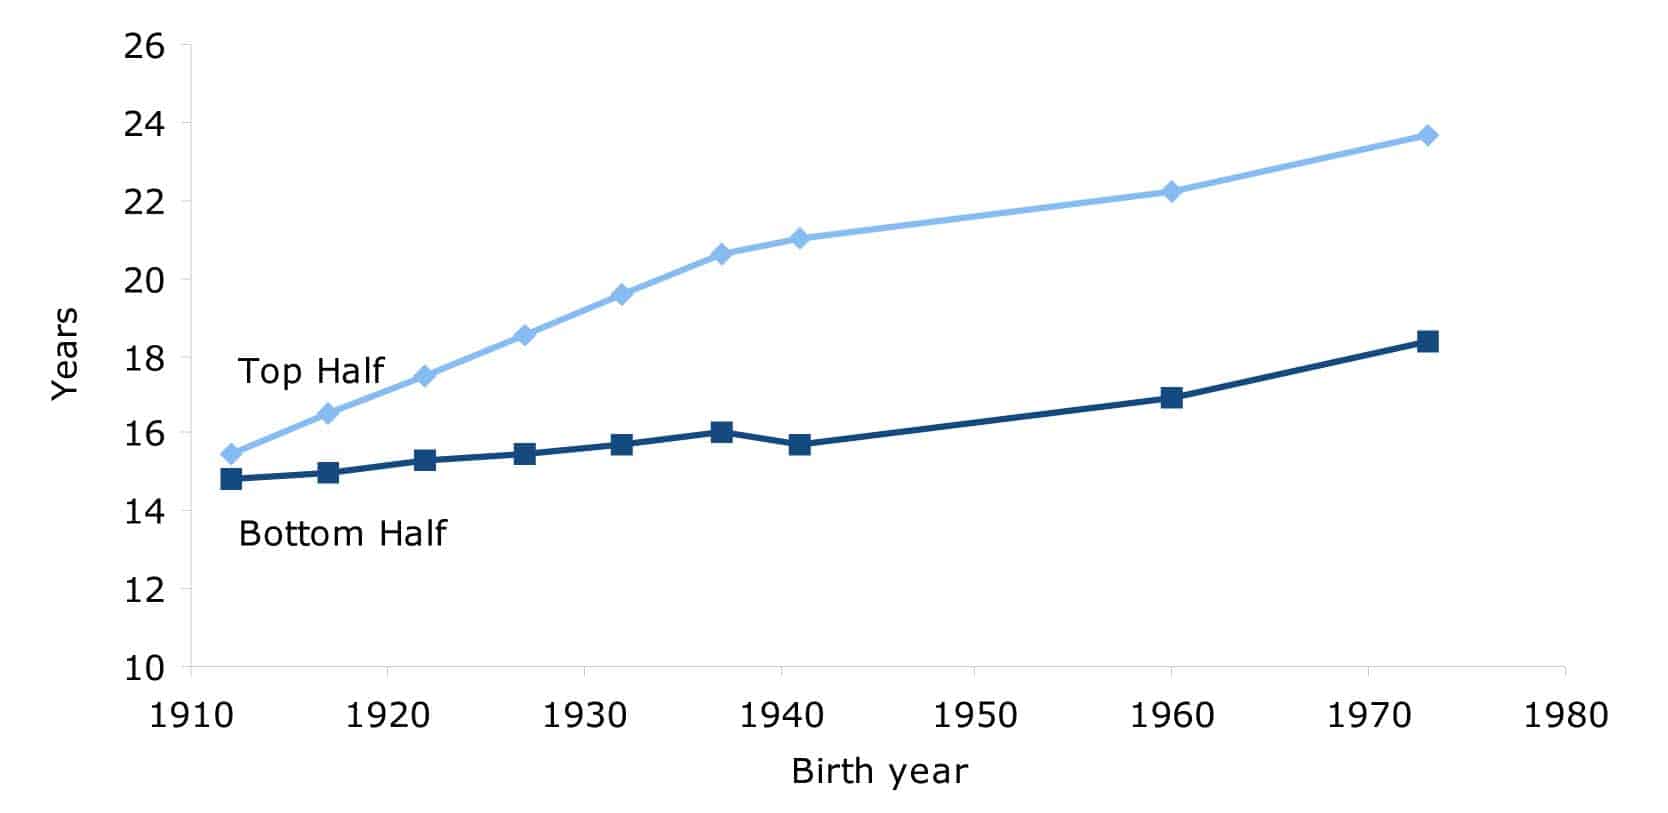
Figure 1 shows the expected years of retirement for men who retire at the Social Security normal retirement age for a range of birth cohorts from 1912 to 1973 under current law.3 For men born between the years of 1912 to 1941 in the upper half of the wage distribution, there was a substantial increase in the expected length of retirement. Those born in 1912 could expect to live 15.5 years after turning age 65. This had increased by 5.5 years to 21.0 years for those born in 1941. The gain was much smaller for those in the bottom half of wage earners born in 1941, with the expected duration of retirement increasing by just 0.9 years from 14.8 years to 15.7 years.
The increase in the normal retirement age will largely offset the expected gain in life expectancy for workers born in 1960. Assuming that there is no further increase in inequality in life expectancy, male workers born in 1960 in the upper half of the wage distribution can expect 22.2 years of retirement if they retire at the normal retirement age, 1.1 years more than the 1941 birth cohort. Workers in the bottom half can expect just 16.9 years of retirement.
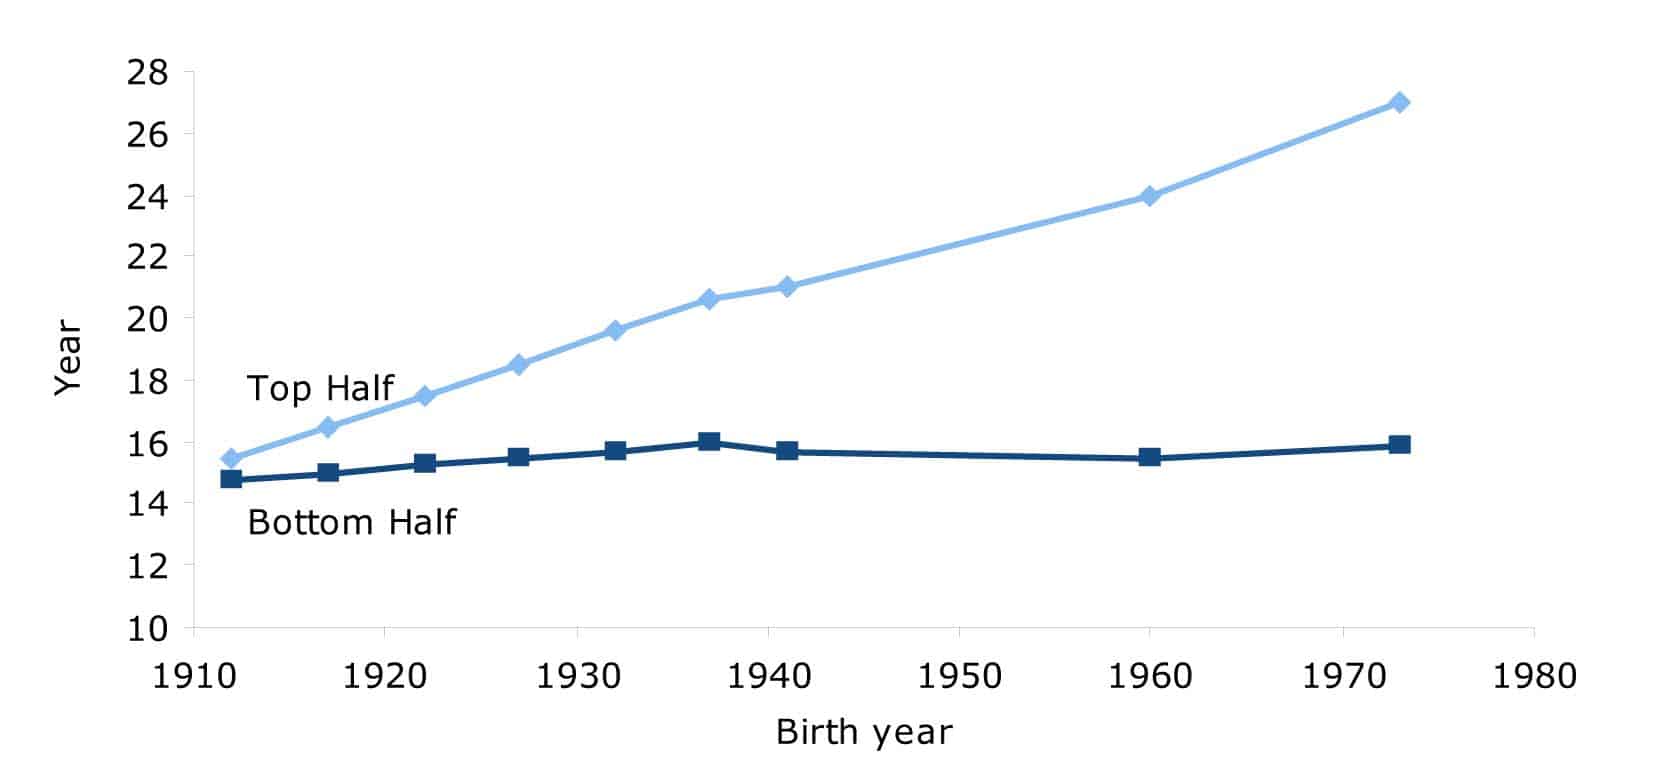
It is possible that the recent trend in inequality in life expectancy will continue over this period. In this case, workers in the upper half of the age distribution will see an increase of 3.0 years in the expected length of their retirement as shown in Figure 2. However, workers in the bottom half of the income distribution will see their expected length of retirement fall back by 0.2 years, to 15.5 years, the same number of years of expected retirement as the 1927 birth cohort. If recent trends in inequality continue, then workers in the bottom half of the wage distribution born in 1973 will still not be able to expect as long a retirement as workers born in 1941.
FIGURE 1: Life Expectancy at Normal Retirement Age (Future Inequality Constant)
Source: Author’s analysis of Social Security Administration data (Waldron, 2007).
FIGURE 2 Life Expectancy at Normal Retirement Age (Inequality Continues to Grow)
Source: Author’s analysis of Social Security Administration data (Waldron, 2007).
Figures 1 and 2 show expected lengths of retirement under current law. However there are many proponents of increasing the retirement age. Figures 3 and 4 show expected lengths of retirement if the normal retirement age is raised by three years more than in current law, so that it hits age 70 for workers who are age 62 in 2035. This would imply an increase in the normal retirement age of two months a year beginning in 2012.
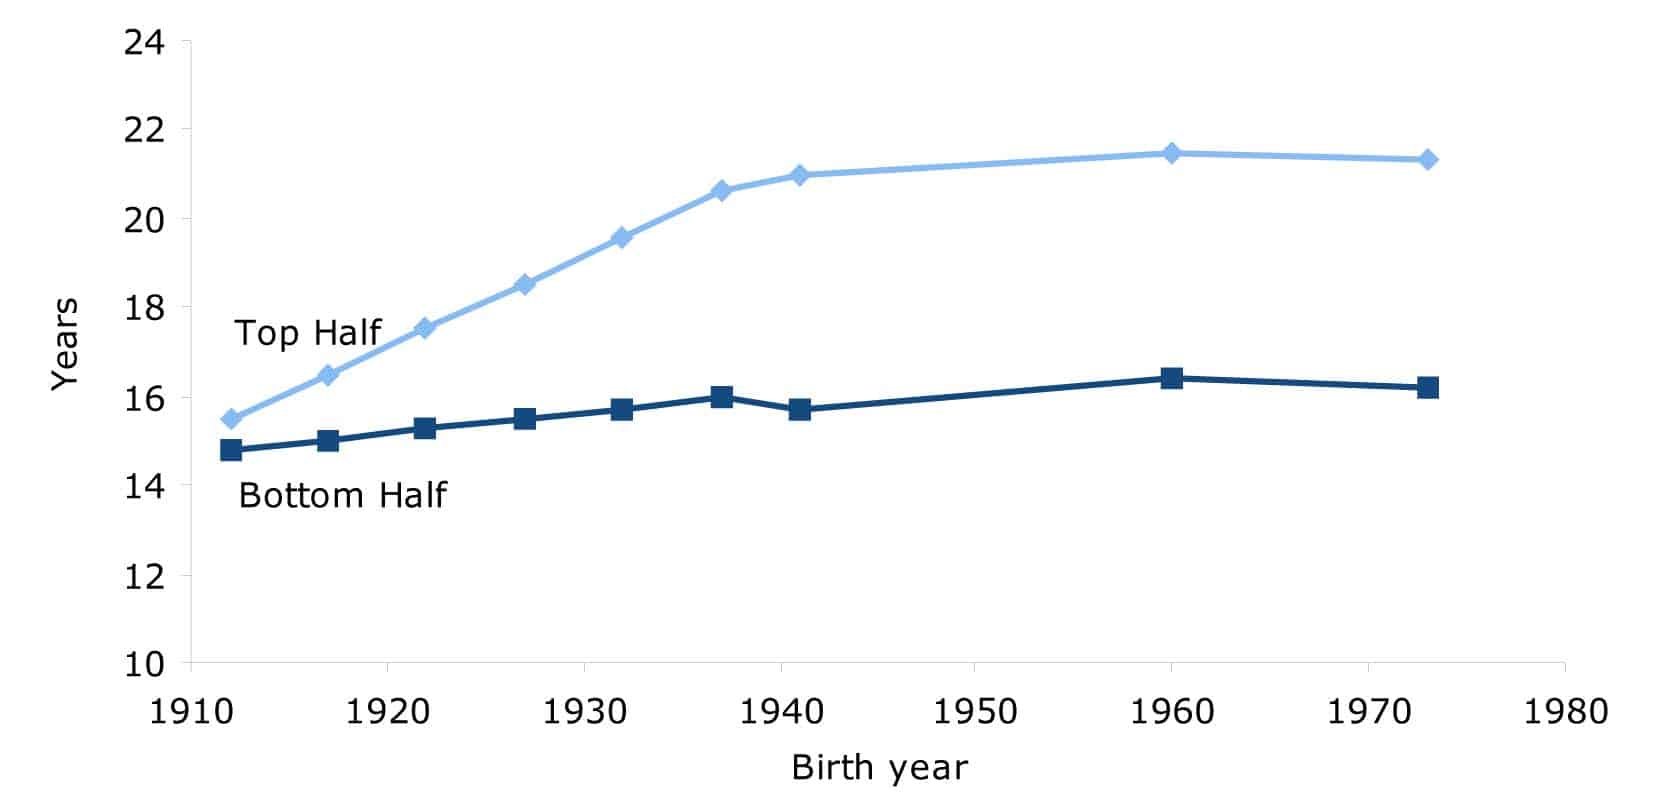
In this scenario the increases in the retirement age largely offset the increase in life expectancy for the birth cohorts between 1941 and 1973. Workers in the upper half of the wage distribution born in 1973 can expect to live 21.3 years after reaching normal retirement age, 0.3 years more than workers born in 1941. This is shown in Figure 3. Workers in the bottom half of the wage distribution born in 1973 can expect to enjoy 16.2 years in retirement.
FIGURE 3: Life Expectancy at Normal Retirement Age (Rise in Retirement Age, Inequality Remains Constant)
Source: Author’s analysis of Social Security Administration data (Waldron, 2007).
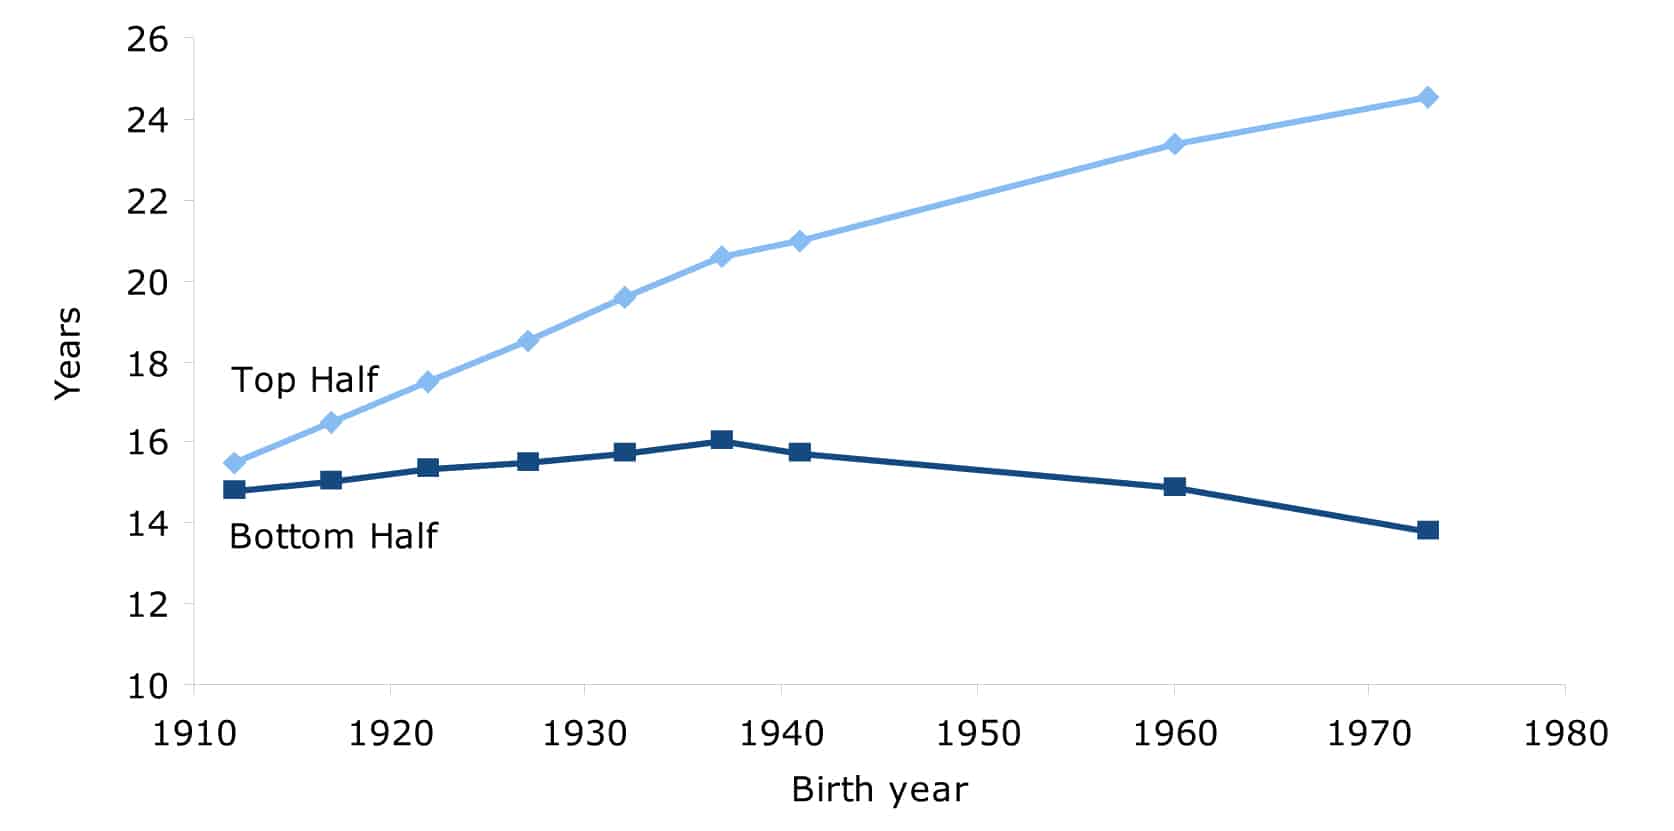
If the recent trend of growing inequality in life expectancy continues through the next three decades, then workers in the bottom half of the wage distribution can anticipate substantial reductions in the expected length of retirement if the normal retirement age is increased in accordance with this schedule. A male worker born in 1973 retiring at age 70 can expect to live 13.8 years in retirement, a full year less than the expected length of retirement for a worker born in 1912, as shown in Figure 4. In this scenario, workers in the top half of the distribution will continue to see rises in the expected length of their retirement. These workers can anticipate 24.5 years of retirement if they retire at age 70.
FIGURE 4: Life Expectancy at Normal Retirement Age (Rise in Retirement Age, Inequality Continues to Grow)
Source: Author’s analysis of Social Security Administration data (Waldron, 2007).
Conclusion
There has been a sharp rise in inequality in life expectancy by income over the last three decades that mirrors the growth in inequality in income. As a result, the bottom half of male earners have seen little gain in expected years of retirement over this period, if the age of retirement is held constant. The increase of the normal retirement age to 67 in current law will largely eat up gains in life expectancy for workers born in the 1960 cohort. This means that if these workers retire at the normal retirement age of 67, they can expect 1.1 more years of retirement than the cohort born 19 years earlier. If the recent trends in inequality continue, then workers born in 1960 in the bottom half of the wage distribution will see a modest decline in their expected years of retirement if they retire at the normal retirement age.
If the normal retirement age is increased to age 70 over the next 25 years, as advocated by many policymakers, then the rise in the retirement age will continue to offset most of the increase in life expectancy. In the event that trends in inequality continue, then workers in the bottom half of the wage distribution will see a decline in the expected length of their retirement. For these workers, in the higher retirement age scenario, the expected years of retirement will be less for the 1973 birth cohort than it was for the 1912 birth cohort.
If policy is designed to encourage people to work later in their lives then it is also important that the economy produce jobs that accommodate the needs of older workers. This does not appear to be the case at present, as nearly half of workers over the age of 58 work at jobs that are either physically demanding or involve difficult work conditions.4 Clearly more thought must be given to the implications of increases in the retirement age than seems to have been the case thus far.
Appendix: Construction of the Cohort Life Tables
Cohort life tables beginning at age 60 were reconstructed entirely from survival curves presented by Social Security.5
The number of survivors at each age x and income class were taken to be the average of the number of survivors at exact age x and x+1, so the probability of death at exact age x was computed directly from the table. The probabilities of death at each exact age and class for those born in 1912 and 1941 were computed from the exact-age populations. The log-probabilities of death at each age and class for years between 1912 and 1941 were linearly interpolated.
Two extrapolations of the probability of death for each age and class were made. For the increasing-inequality case, the log-probabilities were linearly extrapolated at the 1912-41 rate of change for the specific age and class. For the constant-inequality case, a common rate of change in log-probability for each class was used — equal to the average of the 1912-41 log rates of decline at each age.
From the probabilities of death, life tables were constructed based on standard methods as described by Social Security.6 As a check of the methodology, the point estimates in Table 4 of the Working Paper7 were reproduced from the computed life tables.
Life expectancies were then computed at normal retirement age under assumptions of current law8 and alternately under assumptions that the retirement age would be raised by two months for every year of birth to age 70 for those turning 62 in 2035.
1 It is worth noting that vast majority of workers retire at or near age 62, the year where they first qualify for reduced retirement benefits.
2 The trends in inequality in life expectancy are derived from data from the Social Security Administration on mortality: Waldron, Hilary. 2007. “Trends in Mortality Differentials and Life Expectancy for Male Social Security–Covered Workers, by Average Relative Earnings.” Washington, DC: Social Security Administration, available at www.ssa.gov/policy/docs/workingpapers/wp108.html. See the appendix for a full explanation of the methodology. This analysis of the impact of inequality on changes in expected length of retirement is similar to an analysis by Morrissey, Monique and Emily Garr. 2009. “Working the Graveyard Shift: Why Raising the Social Security Retirement Age Is Not the Answer.” Washington, D.C.: Economic Policy Institute, available at epi.3cdn.net/65bf2e24d59cf56166_dym6ive5s.pdf.
3 There is only data on differences on life expectancy by income for men.
4 See Rho, Hye Jin. 2010. “Hard Work: Patterns in Physically Demanding Labor Among Older Workers.” Washington, DC: Center for Economic and Policy Research, available at www.cepr.net/documents/publications/older-workers-2010-08.pdf.
5 Waldron (2007), www.ssa.gov/policy/docs/workingpapers/wp108chart01.html.
6 Bell, Felicitie C. and Michael L. Miller. 2005. “Life Tables for the United States Social Security Area 1900-2100.” Washington, DC: Social Security Administration, available at www.ssa.gov/OACT/NOTES/pdf_studies/study120.pdf.
7 Waldron (2007).
8 www.ssa.gov/OACT/ProgData/nra.html.
Dean Baker is an economist and Co-Director of the Center for Economic and Policy Research in Washington, D.C. David Rosnick is an economist at CEPR. This article was first published by CEPR under a Creative Commons license.
| Print
