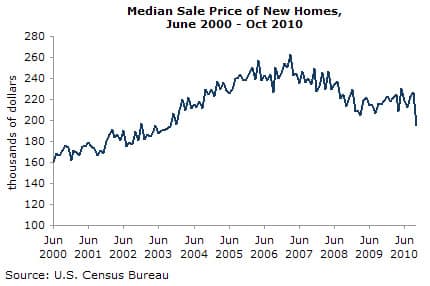
The Census Bureau reported last week that the median price for a new home fell from $226,300 in September to $194,900 in October, a one-month decline of 13.9 percent. While new home sales prices are always erratic and the October data were pushed downward in part by a relative increase in sales in the low-cost South region, this is the lowest reported price since October of 2003, when the median price was $194,100. The October data suggests that house prices may again be falling rapidly.
This is also the picture given in the September Case-Shiller data. The 20-City index fell by 0.7 percent, with only Washington, D.C. and Las Vegas posting modest gains. The other 18 cities all had declining house prices for the month.
The sharpest decline was in Cleveland, which had a 3.0 percent drop in prices in September. Prices have fallen at a 12.4 percent annual rate over the last quarter. Prices in Minneapolis fell 2.1 percent for the month and have dropped at a 7.0 percent rate over the quarter. In Portland, prices fell by 1.9 percent and have now dropped at an 11.4 percent annual rate over the last quarter. Phoenix is also seeing sharp price declines again with prices dropping 1.5 percent in September and having fallen at a 13.1 percent annual rate over the last quarter.
The price declines are being driven primarily by sharp drops in the bottom tier of the market. Prices for homes in the bottom tier had a 2.6 percent one-month decline in both Seattle and Boston. They fell by 3.4 percent in Phoenix and 3.7 percent in Portland. Prices for homes in the bottom tier fell by 3.9 percent in both Tampa and Chicago. They fell by 7.0 percent in Atlanta and 7.4 percent in Minneapolis.
The annual rate of price decline over the last quarter for bottom-tier homes has been incredible in several of these cities, with prices dropping at a 26.9 percent rate in Tampa and a 27.0 percent annual rate in Phoenix. The annual rate of decline for bottom-tier homes in Minneapolis was 33.1 percent. It was 42.1 percent for bottom-tier homes in Atlanta.
Clearly, this plunge is a response to the end of the first-time homebuyers tax credit. This credit disproportionately affected homes in the bottom tier both because these were the homes most likely to be purchased by first-time buyers and also because the credit was a larger share of the price.
With the sharp price declines in many cities since the expiration of the tax credit, the loss of equity has likely exceeded the amount of the credit for many buyers. In other words, they would have been far better off buying at current prices without the credit than having bought earlier in the year and received the benefit of the credit.
For these buyers, the credit effectively amounted to a transfer to the seller, or in the case of many underwater sellers, to the investors holding the mortgage. From this perspective, the tax credits were good policy for banks and other mortgage holders but provided little benefit to homebuyers. They also did nothing to sustain the housing market over the long run.
The October data on new home prices provide serious grounds for concern about the future direction of house prices. It is important to remember that Case-Shiller data is a three-month average, based on sales prices, for a period that ends two months before the release of the data. Given the lag between contracts and closings, the period of contracting for the most recent data ran primarily from May-July, the period immediately after the expiration of the tax credit.
By contrast, the new home sales data reflect contracts that were actually signed in October. For this reason, it gives a much more up-to-date picture of the state of the market. It is likely that with homes sitting unsold for many months, and little prospect for new government assistance in sight, sellers are now cutting prices in a desperate effort to unload their homes. This could mean another period of rapid price declines as the bubble completes its process of deflation.
Dean Baker is an economist and Co-director of the Center for Economic and Policy Research, in Washington, D.C. This article was published by CEPR on 30 November 2010 under a Creative Commons license.
| Print

