A national campaign is now fully launched to make local public sector employees pick up a major share of the costs of economic crisis. Years of rising spending and falling revenue have carved a path of destruction through federal, state, and local budgets. Deficits and debts have mounted, eroding taxpayer support for government spending in general and for public employees particularly. In response to deep economic pains in middle-class communities, major efforts are under way, from California to Maine, to balance budgets through major cuts in services, wages, benefits, and employment.
Federal, state and local governments are staggering from reduced tax revenues because of unemployment, reduced production, lower investment, and the housing collapse. Washington borrowed huge sums from foreign investors, domestic big business, and the rich. These funds went to bail out select businesses and to help (partially and temporarily) broken state and local government budgets. Because Democrats and Republicans agreed last December to not increase income, estate, and capital gains taxes, broken state and local budgets face declining federal support. This is driving governors, mayors, and state legislatures to raise taxes and/or to slash payrolls and programs. Of course some cutting and tax increases are required. The real social decisions involve what to cut, how much, for whom, and whose taxes to increase.
The pressure is on to shift the heavy costs of economic crisis onto the middle- and low-income communities already stung by unemployment, foreclosures, reduced job benefits, and rising job insecurity. The campaign to make the middle- and lower-income Americans pay now focuses on public employees — especially their numbers, incomes, and benefits. Battles loom over which state and local job holders get fired, whose pensions/benefits will be reduced, and which public services will stop being available.
Politicians will keep silent on the key alternative to deep cuts — precisely because it would otherwise be on most citizens’ agendas. That alternative would be to raise the tax share paid by leading firms and the wealthiest 5-10% of citizens. In most cases, this means returning to the levels of taxation in the 1980s. Whatever may be needed in the way of reasonable rationalizations and savings in government budget outlays, we will not exit the continuing economic crisis by massive reductions in public service provision and employment. Those only further depress the economic conditions and wellbeing of middle- and lower-income communities. This would be a more and more cruel version of the track we have been on for decades. Sadly, this approach is neither new nor likely to work.
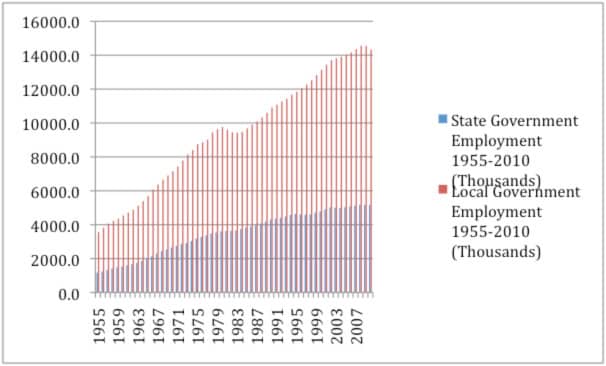
The facts don’t support the attacks on public employees. Last year, total state and local employment declined by 407,000 jobs. Figure 1 shows what has happened to public employment in our states and localities over the last half-century.
Figure 1: State and Local Employment Bureau of Labor Statistics CES

Figure 1 shows that there are about 20 million state and local workers in America today: 14.3 million local and 5.2 million state employees. Until the last decade, the numbers of public employees grew steadily as did the US population. Unemployment levels in our communities would have been much higher had those workers not found public jobs. State and local government would have provided far fewer and/or poorer public services had state and local employment not grown. Of course, there are stories of waste and corruption. Nonetheless, we all need and benefit from many state and local services.
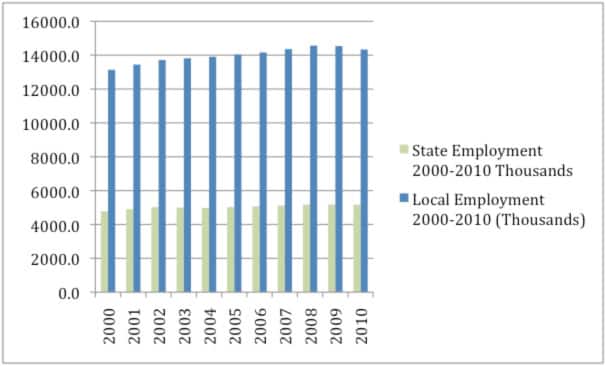
Figure 2 shows that over the last decade, state and local employment did not grow very rapidly. As the US economy moved toward crisis, state and local governments did not notably expand their payrolls. Their economics did not spin out of control as did our financial industry and other parts of the private sector. Some states and localities even trimmed their tax rates. Assumptions were made about a lasting housing and equity market boom. These proved false. In many cases the pain emerges slowly as properties are reappraised, sales tax revenues fail to rise amid record unemployment, and huge numbers of citizens do without health care coverage.
Figure 2: BLS Data State and Local Government Employment 2000-2010 (Thousands)

Some now paint public employees as “fat cats.” In 2009 (the latest available data), the average state employee earned $23.67 per hour or $49,240 per year.1 The average local government employee earned $21.68 per hour or $45,090 per year.2 These are averages. There are considerable differences among individual public employee earnings depending on her/his location, age, and job type. There are huge ranges in pay by locality and union membership as well.
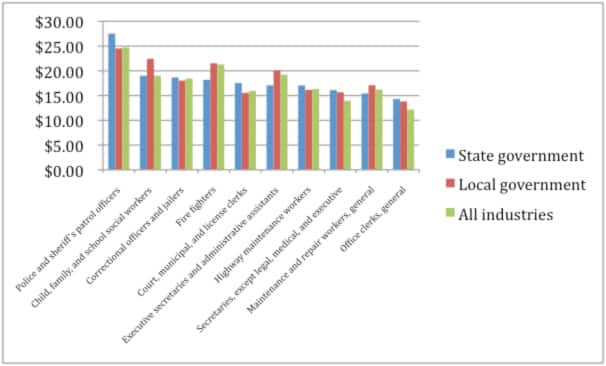
By comparison, the national average earning per hour for all employed Americans in December of 2009 was $22.38 or $44,760 for a 2,000 hour year. In other words, state and local government employees earned about the national average in 2009 and 2010. Figure 3 below lists the most common jobs and salaries for state and local employees according to the BLS Career Guide to Industries, 2010-2011 Edition.3 State and local government employees’ earnings were close to the national averages in most occupations. Labeling all public employees “fat cats” is an attempt to make mostly middle-class earners and all social service consumers pay for what the economic crisis did to state and local budgets.
Figure 3: Most Common State and Local Government Occupations and Mean Hourly Compensation

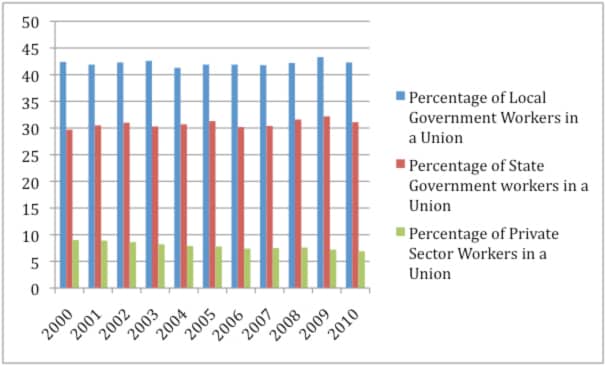
Another part of the campaign against state and local workers is aimed at their unions. But here too the facts offer a more honest picture. State and local government employees are more unionized than private sector workers. Approximately 12.3% (or 14.7 million people) of the total US labor force is represented by unions. That includes a 612,000 member decline in 2010. About 36% of public sector workers were unionized in 2010 as compared to 6.9% of private sector workers. Figure 4 shows that local public employees (teachers, police and fire personnel, and others closest to the communities they serve) were the most unionized. Figure 4 also shows that the majority of state and local public employees are not unionized, just like the vast majority of private sector workers. Portraying public employees or their unions as the primary problem is not supported by the facts.
Figure 4. BLS Data % of Workers Unionized by Employer Type

In conclusion, consider exactly who public employees are. Equal Opportunity Employment Committee data from 2007 suggest that 18% of full time state employees are African-American4 while that number for local employees is 19%.5 Public employment has reduced African-American unemployment, reaping social benefits for everyone. Because African-Americans have a higher-than-average union membership, attacking state and local union jobs targets them especially. Veterans are also significantly over-represented in public sector employment at both the state and local level. In 2009, nearly 13% of all employed veterans worked for state and local government.6 Third, public sector employees tend to stay at jobs longer and tend to be older than private sector workers. Our at-risk state and local workers are disproportionately likely to be of color, in unions, older and veterans.
Most importantly, state and local employees provide vital services to all. Our education, transport, protection, courts, and civic participation rely on public sector workers. Over 85% of Americans are educated in public institutions, from first grade through university. Our police, fire, courts, social workers, and clerks keep all of us and our property secure. Our roads, bridges, tunnels, ports, trains, buses and security are public sector work. Our diversity and our veterans are well represented among our public sector workers. Cutting the public sector will worsen the economic crisis while deepening many social problems. No discussion about real and serious budget adjustments should proceed from ignorance about what public sector workers do, who they are, and what they are paid. No society moves wisely without acknowledging and factoring the real lives at stake and the real effects of budget decisions.
1 BLS Occupational Employment Statistics (OES) Data: <bls.gov/oes/current/naics4_999200.htm>.
2 BLS Occupational Employment Statistics (OES) Data: <bls.gov/oes/current/naics4_999300.htm>.
4 Equal Employment Opportunity Commission, State and Local Government Information (EEO-4), 2007, Employment Summary by Job Category and Government Type, Government Type: 1 – State: <eeoc.gov/eeoc/statistics/employment/jobpat-eeo4/2007/type/1%20-%20STATE.html>.
5 Equal Employment Opportunity Commission, State and Local Government Information (EEO-4), 2007, Employment Summary by Job Category and Government Type, Government Type: 3 – CITY: <eeoc.gov/eeoc/statistics/employment/jobpat-eeo4/2007/type/3%20-%20CITY.html>.
6 BLS Employment Situation of Veterans: <bls.gov/news.release/vet.t04.htm>.
Max Fraad Wolff teaches economics in the New School University Graduate Program in International Affairs. Richard D. Wolff is Professor Emeritus at the University of Massachusetts in Amherst and also a Visiting Professor at the Graduate Program in International Affairs of the New School University in New York. He is the author of New Departures in Marxian Theory (Routledge, 2006) among many other publications. Check out Richard D. Wolff’s documentary film on the current economic crisis, Capitalism Hits the Fan, at www.capitalismhitsthefan.com. Visit Wolff’s Web site at www.rdwolff.com, and order a copy of his new book Capitalism Hits the Fan: The Global Economic Meltdown and What to Do about It.
var idcomments_acct = ‘c90a61ed51fd7b64001f1361a7a71191’;
var idcomments_post_id;
var idcomments_post_url;
