 This morning, the U.S. Department of Labor (pdf) reported that, during the week ending last Saturday, another 6.61 million American workers filed initial claims for unemployment compensation. That’s on top of 6.65 million workers who were laid off during the week ending 28 March and another 3.31 million in the previous week.
All told, more than 16 million American workers have filed initial claims during the past three weeks.
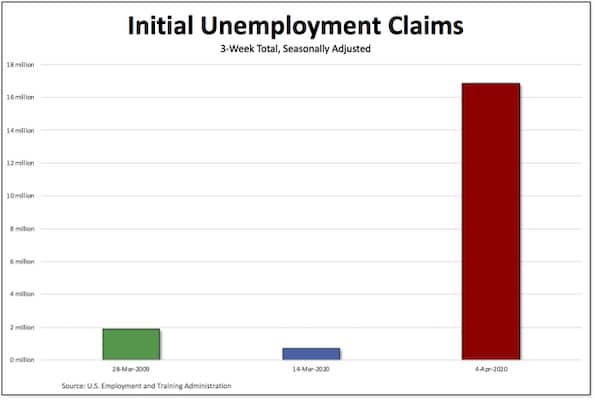
To put that into some kind of perspective, I calculated the initial claims totals for two other relevant 3-week periods: the worst point of the Second Great Depression (encompassing the weeks ending on 14, 21, and 28 March 2009) and the weeks immediately preceding the current one (so, 29 February and 7 and 14 March 2020).
As readers can see in the chart above, the difference is stunning: 1.86 million workers filed initial claims during the worst 3-week period of 2009, 710 thousand from late February to mid-March of this year, and 16.78 million in the past three weeks.
And keep in mind, the most recent numbers don’t include perhaps millions of other American workers, since many states are still addressing backlogs of claims. Masses of workers have been unsuccessful in applying for unemployment insurance because state websites are freezing and their phones are inundated with inquiries.
