Should supply greatly exceed demand, a section of the workers sinks into beggary or starvation. The worker’s existence is thus brought under the same condition as the existence of every other commodity.
— Karl Marx, Economic and Philosophic Manuscripts of 1844
This morning, the U.S. Department of Labor (pdf) reported that, during the week ending last Saturday, another 2.44 million American workers filed initial claims for unemployment compensation. That’s on top of the 36.49 million workers who were laid off during the preceding seven weeks.
Here is a breakdown of each week:
• week ending on 21 March—3.31 million
• week ending on 28 March—6.87 million
• week ending on 4 April—6.62 million
• week ending on 11 April—5.24 million
• week ending on 18 April—4.44 million
• week ending on 25 April—3.85 million
• week ending on 2 May—3.17 million
• week ending on 9 May—2.98 million
• week ending on 16 May—2.44 million
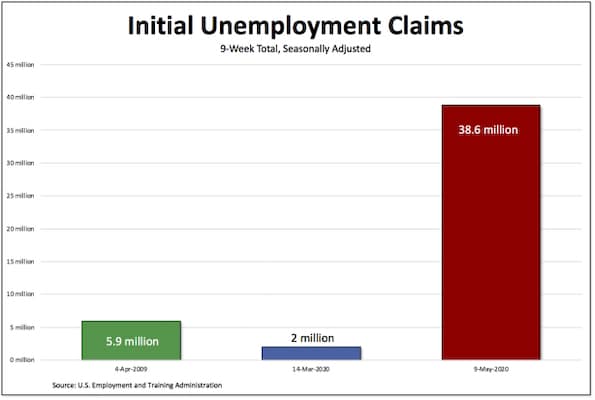
All told, 38.6 million American workers have filed initial unemployment claims during the past nine weeks.
To put that into some kind of perspective, I calculated the initial claims totals for two other relevant nine-week periods: the worst point of the Second Great Depression (encompassing the weeks ending on 7, 14, 21, 28 February, 7, 14, 21, and 28 March, and 4 April 2009) and the weeks immediately preceding the current depression (so, 18 and 25 January, 1, 8, 15, 22, and 29 February and 7 and 14 March 2020).
As readers can see in the chart above, the difference is stunning: 5.87 million workers filed initial claims during the worst nine-week period of 2009, 1.98 million from late January to mid-March of this year, and 38.64 million in the past nine weeks.
Once again, keep in mind, the most recent numbers still don’t include perhaps millions of other American workers, since many states are still addressing backlogs of claims. Masses of workers have been unsuccessful in applying for unemployment insurance because state websites and phone lines are inundated and still, even now, not working correctly.
Moreover, because they’re only initial claims, the numbers also don’t include the 7.1 million American workers who were deemed officially unemployed in early March, before most of the shutdowns started.
According to the most recent report from the Bureau of Labor Statistics (pdf), the number of unemployed workers rose by 15.9 million to 23.1 million in April, leading to an official unemployment rate of 14.7 percent—”the highest rate and the largest over-the-month increase in the history of the series.” But the surveys on which those data are based only capture those who were unemployed in mid-April.
If we allow for the fact that at least some workers have been forced to have the freedom to return to work in recent months, then the total number of fully unemployed workers is something on the order of 34.5 million.* That would mean an unemployment rate of around 22 percent, which is getting closer and closer to the rate last seen in the first Great Depression (25 percent) and more than twice the highest rate (10 percent) suffered during the Second Great Depression.**
On top of that, we should add in the workers who are involuntarily working part-time jobs—in other words, workers who would like to have full-time jobs but have been forced “for economic reasons” to accept fewer hours. The reserve army of unemployed and underemployed workers then rises to more than 45 million—or 29 percent of the U.S. labor force.
And, according to Jose Maria Barrero, Nick Bloom, and Steven J. Davis (pdf), something on the order of 42 percent of recent layoffs will result in permanent job loss. As Bloom explains,
Firms intend to hire these people back. But we know from the past that these aspirations often don’t turn out to be true.
*I used the following, perhaps overly generous, assumptions: 1 in 2 workers who were unemployed in mid-March have been able to find jobs and 2 in 10 workers who filed initial claims in the past nine weeks have gone back to work.
**At the highest of levels of unemployment following the 2007-08 crash, there were 15.3 million jobless Americans.

