

Initial unemployment claims in the United State continue to rise.
This morning, the U.S. Department of Labor (pdf) reported that, during the week ending last Saturday, another 1.43 million American workers filed initial claims for unemployment compensation. Last week, it was 1.42 million.
Here is a breakdown of each week:
• week ending on 21 March—3.31 million
• week ending on 28 March—6.87 million
• week ending on 4 April—6.62 million
• week ending on 11 April—5.24 million
• week ending on 18 April—4.44 million
• week ending on 25 April—3.87 million
• week ending on 2 May—3.18 million
• week ending on 9 May—2.69 million
• week ending on 16 May—2.45 million
• week ending on 23 May—2.12 million
• week ending on 30 May—1.90 million
• week ending on 6 June—1.57 million
• week ending on 13 June—1.54 million
• week ending on 20 June—1.48 million
• week ending on 27 June—1.41 million
• week ending on 4 July—1.31 million
• week ending on 11 July—1.31 million
• week ending on 18 July—1.42 million
• week ending on 25 July—1.43 million
All told, 54.1 million American workers have filed initial unemployment claims during the past nineteen weeks.
To put that into some kind of perspective, I produced the chart above comparing the cumulative totals of the initial unemployment claims for the current pandemic compared to two other relevant periods: the worst point of the Second Great Depression (from late January to late May 2009) and the weeks immediately preceding the current depression (from early November 2019 to late March 2020).
As readers can see in the chart above, the differences are stunning: 12 million workers during the Second Great Depression, 4.2 million in the period just before the COVID crisis, and more than 54 million in the past nineteen weeks.
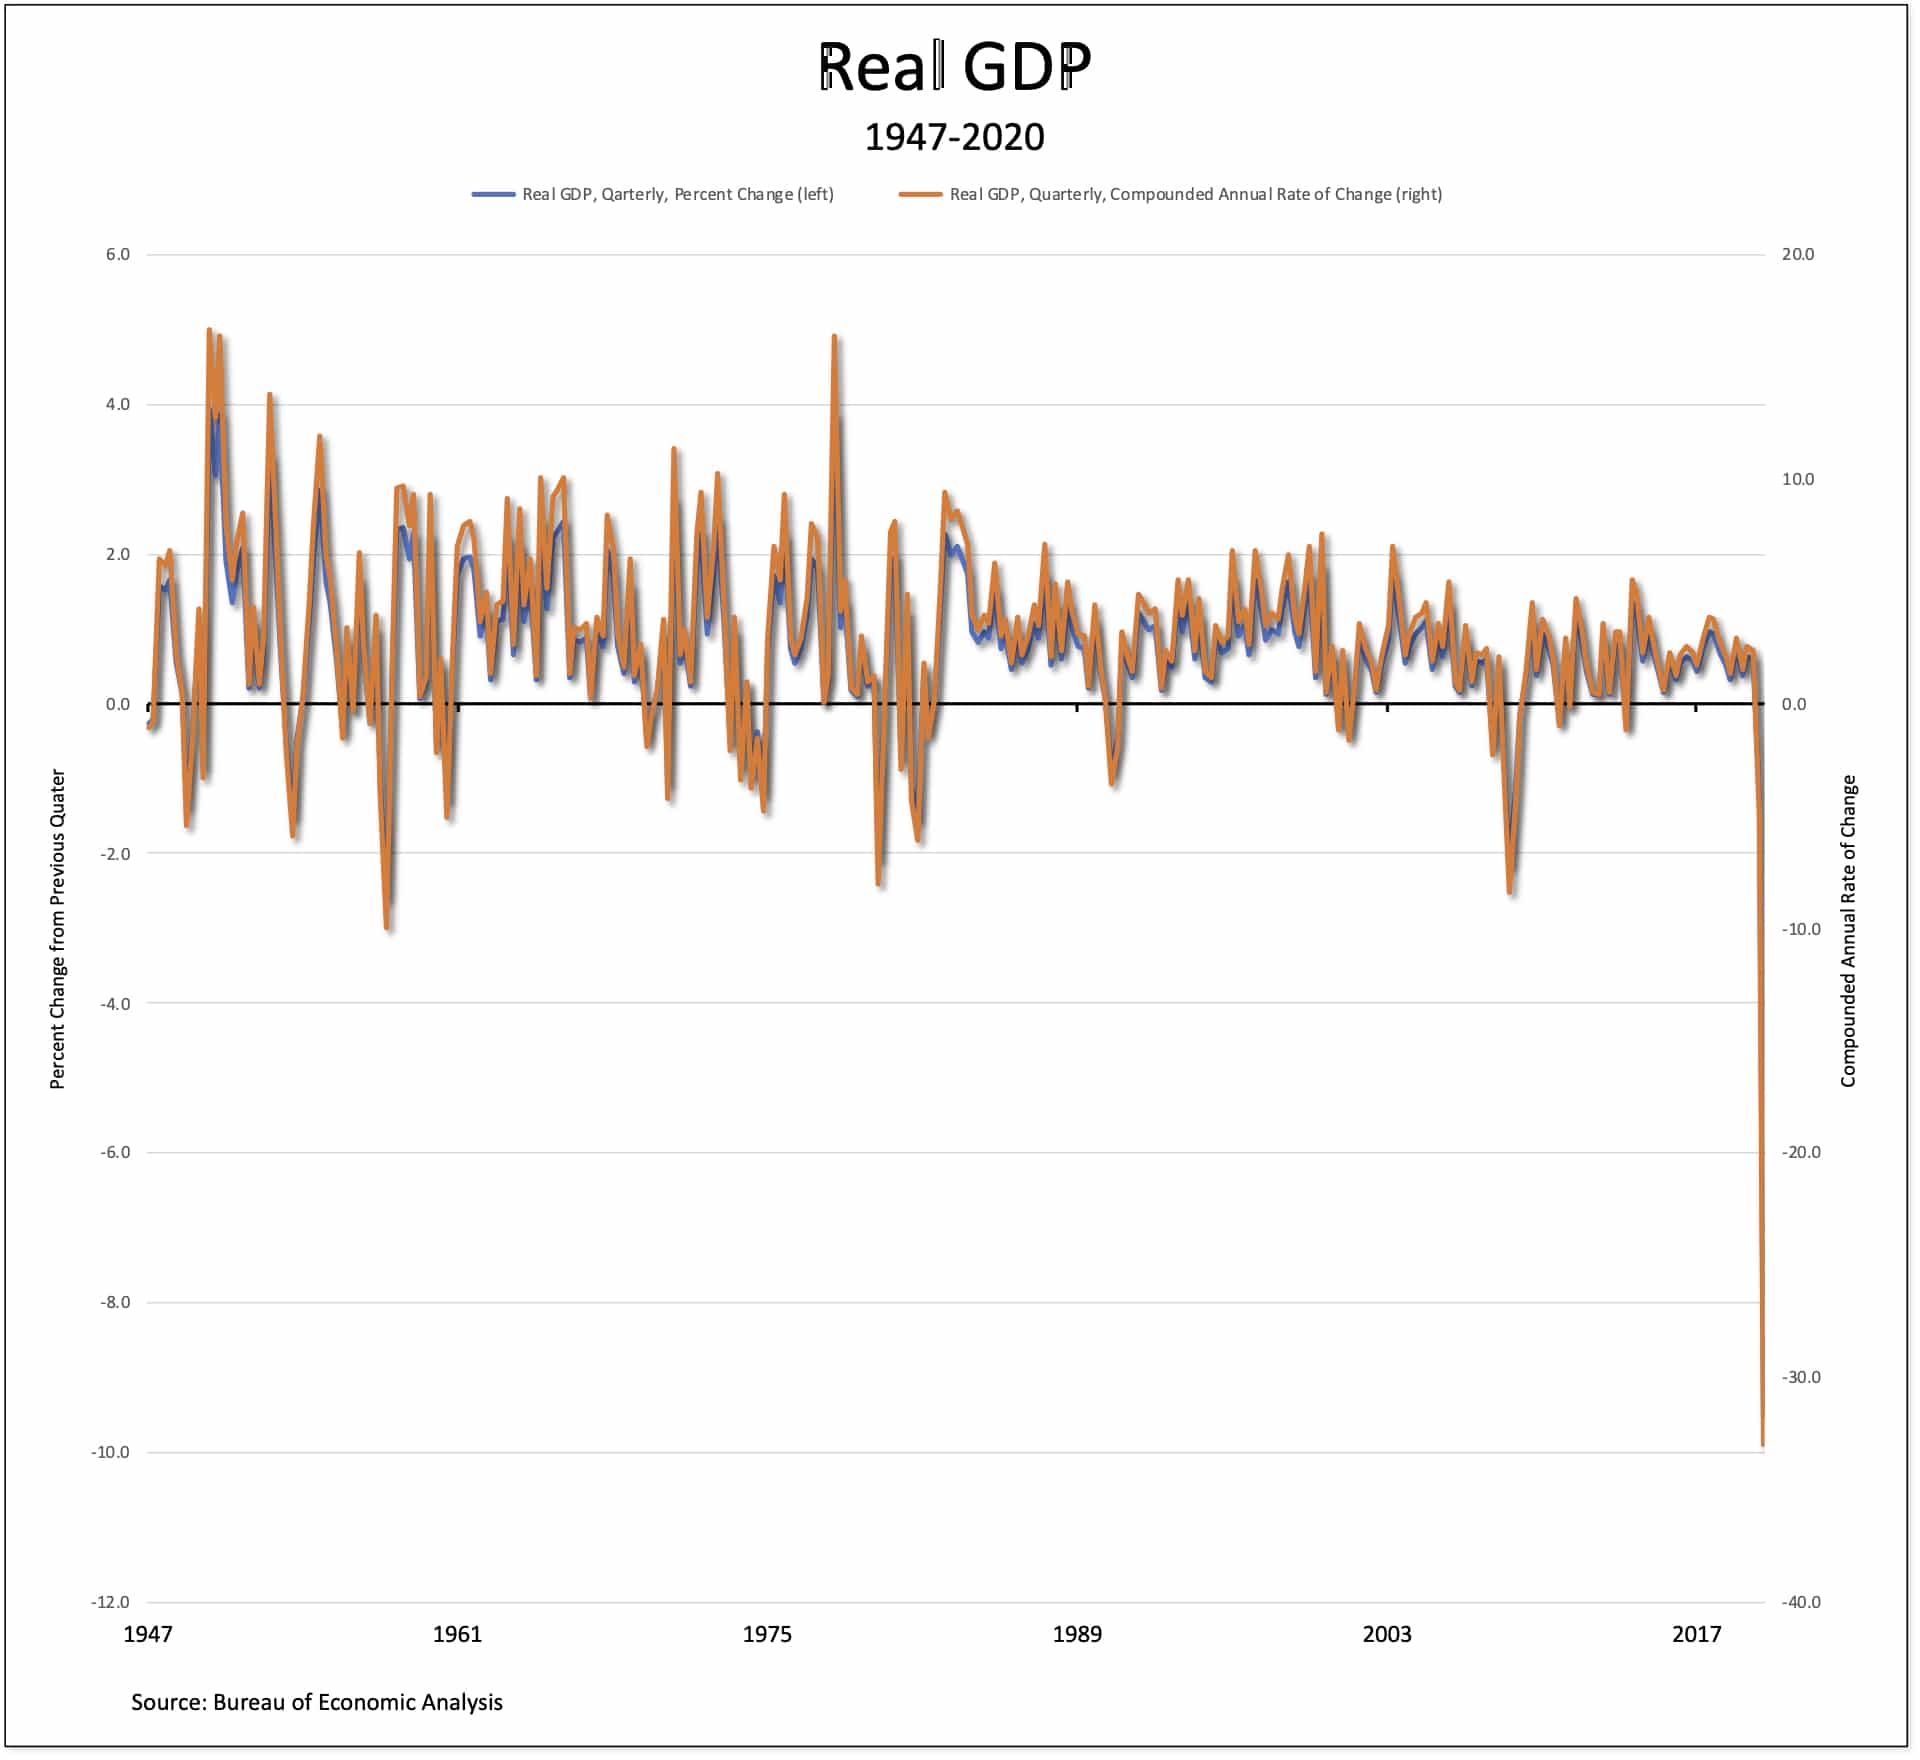
The extraordinarily high numbers of initial claims should come as no surprise, given the decline in economic activity throughout the country. This morning, the Commerce Department reported that real Gross Domestic Product decreased at an annual rate of 32.9 percent in the second quarter of 2020 (corresponding to a drop of 9.5 percent from the first quarter). That is, by far, the most severe drop in the postwar period (the next most significant decline came in the first quarter of 1958, on the order of 10 percent on an annual basis).
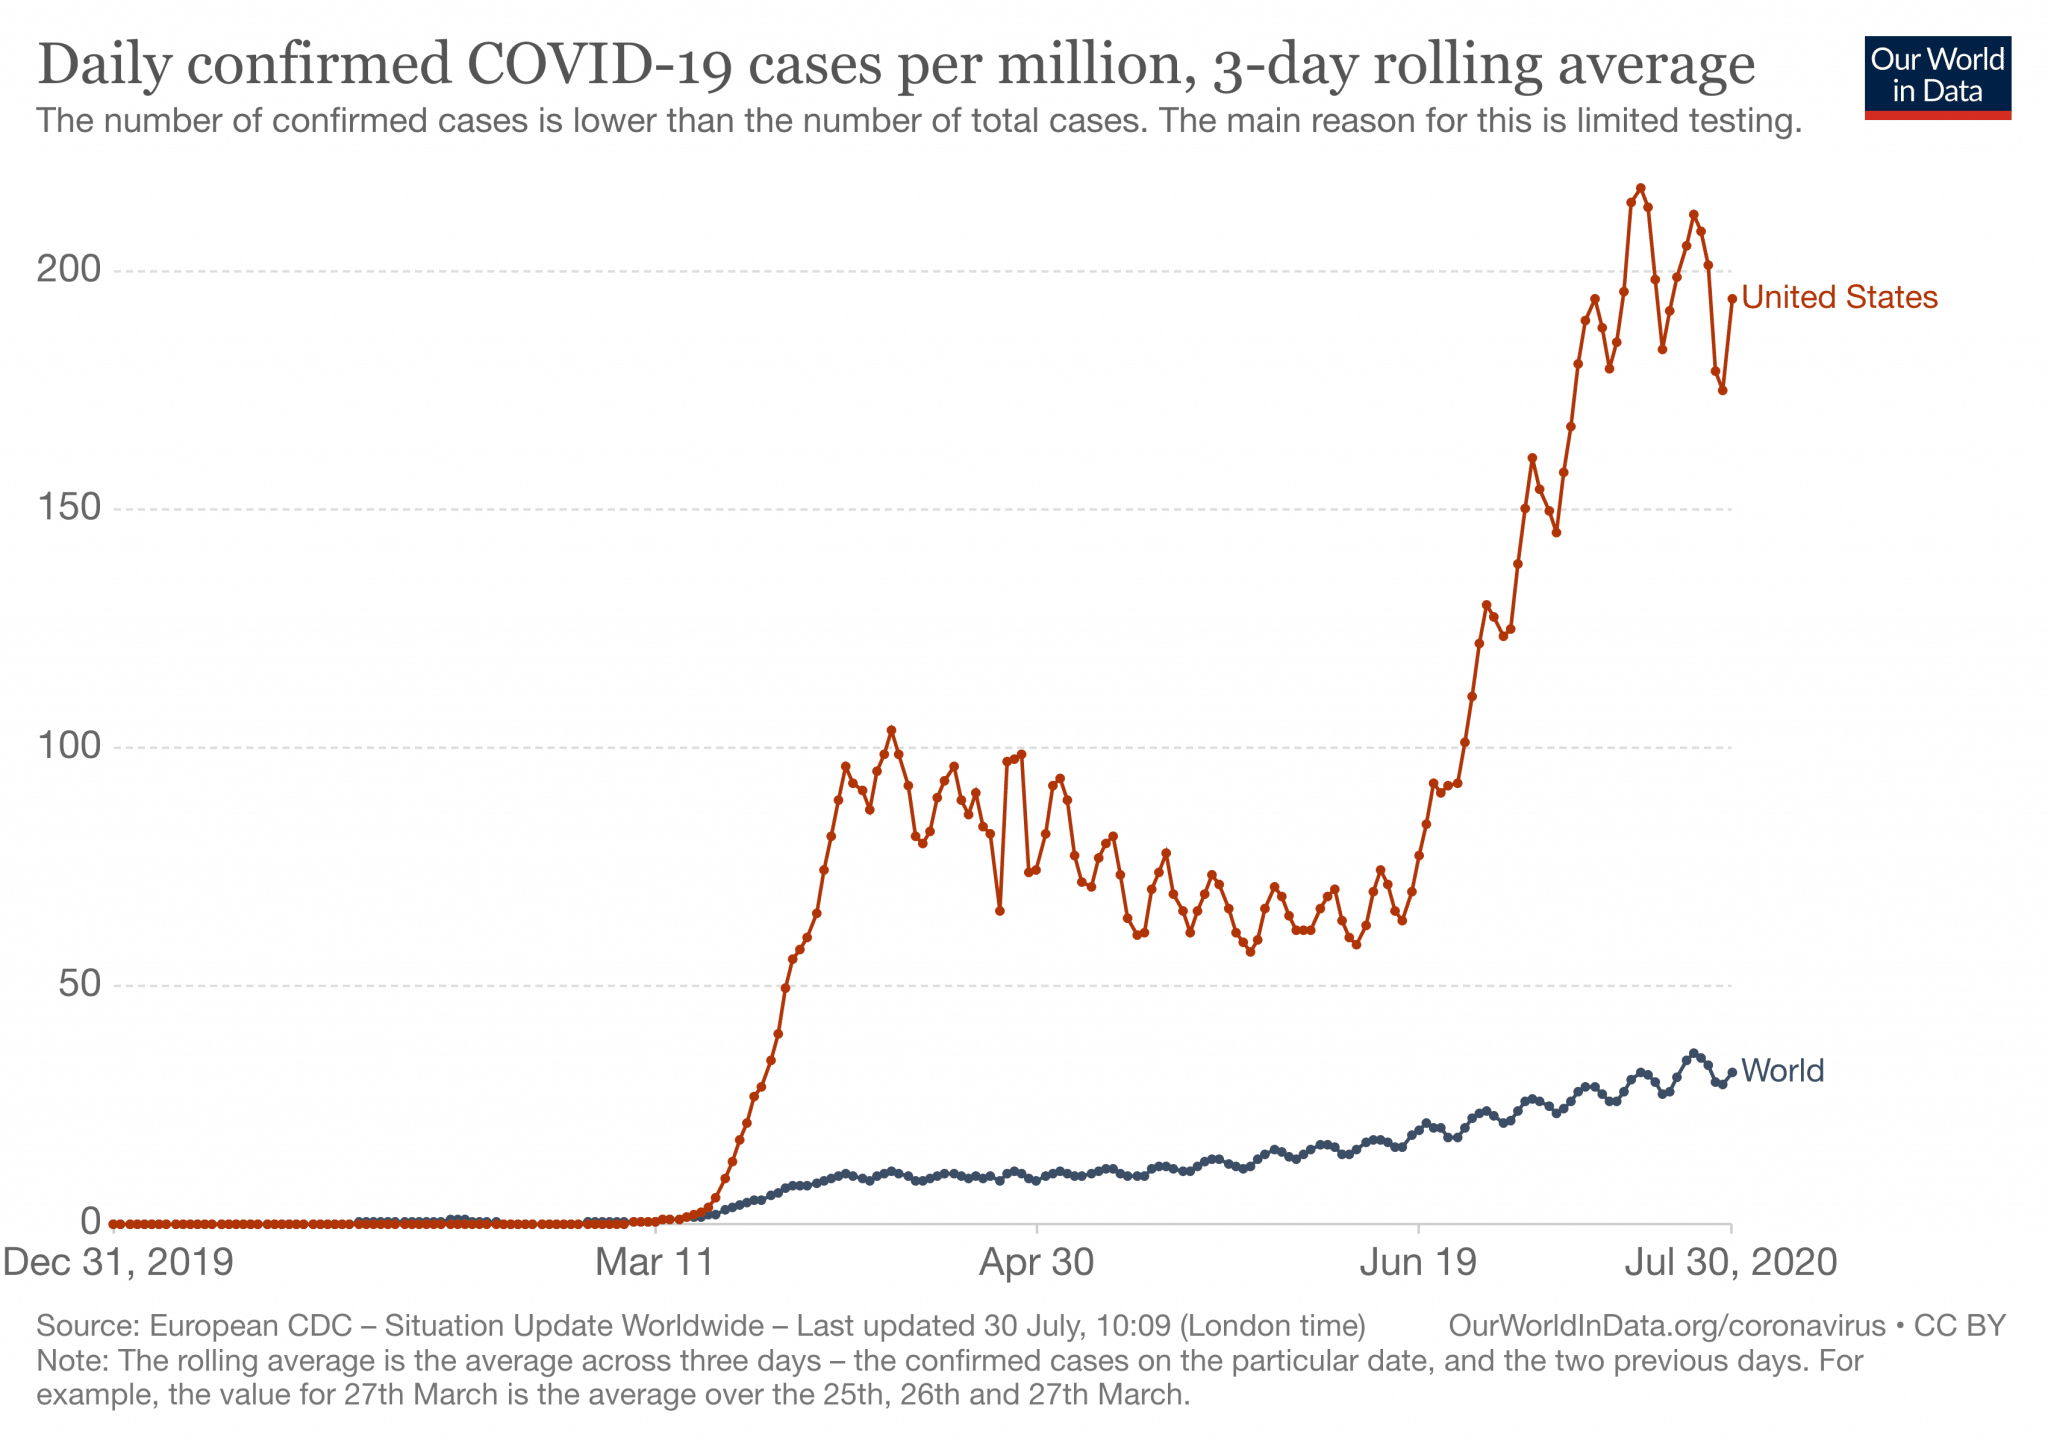
In the meantime, many U.S. states continue to set daily records for new confirmed COVID-19 cases. Today, the three-day rolling average of new cases per million people in the country reached 194 compared to 32 cases for the world as a whole.
We can therefore expect to see new waves of business closures, which in turn will mean more American workers furloughed and laid off, and therefore a steady stream of initial unemployment claims, in the weeks and months ahead.
It is hard to imagine a worse combination to combat the fallout from the novel coronavirus pandemic than Republican governors, the administration of Donald Trump, the GOP-controlled Senate, and the basic institutions of U.S. capitalism.